Report Overview
Skift has broken its online travel agency coverage this year into a multi-part series exploring different aspects of the business model in depth. The first part of the series examined the advertising spend of online travel agencies in North America and Europe. The second part of the series looked at the inventory and supply aspect of these same sites. The final part of the series, below, takes a deep dive into two emerging market booking sites.Part III of our series on the state of online travel agencies in 2018 is a twofer. In it, we profile two fascinating companies in the emerging markets: MakeMyTrip and Despegar. This is Skift Research’s inaugural research coverage for both of these businesses.
Skift believes that the rise of emerging market travelers will be a defining trend over the coming years and studying the business strategies of current leaders in the space can be instructive to executives and investors everywhere.
Not only do India (MakeMyTrip) and Latin America (Despegar) have the potential to be major travel markets, but both have representative companies with public filings, allowing us a detailed look into these businesses that would be near impossible to get for many other regional online travel agencies.
Despite superficial and geographic differences, MakeMyTrip and Despegar have much in common. To name just a few, both are the reigning online travel champions in their respective local markets, have decades of operating experience, do business in highly fragmented markets with relatively low online penetration, and are listed on major U.S. exchanges.
The top lesson we learn is how much care must be taken when localizing a travel offering. Both MakeMyTrip and Despegar are highly evolved to match their regional niches. What works in the U.S. or Europe cannot be copy-pasted to new markets.
In addition to detailing the key market-specific tactics, we go through a complete tear down of these companies’ financial statements and business models in this report.
What You'll Learn From This Report
- Extensive overviews of the Indian and Latin American travel markets
- Corporate strategies of Despegar and MakeMyTrip, including breakdowns of inventory and gross bookings of each
- Corporate strategies and region-specific initiatives setting MakeMyTrip and Despegar apart from North American or European online travel agencies
- Detailed financial analysis of both companies
Executive Summary
Part III of our series on the state of online travel agencies (OTAs) in 2018 is a twofer. In it, we profile two fascinating companies in the emerging markets: MakeMyTrip and Despegar. This is Skift Research’s inaugural research coverage for both of these businesses.
Developing countries now account for 83% of the world’s population, yet just 35% of GDP and 41% of outbound travelers.
Skift believes that the rise of emerging market travelers will be a defining trend over the coming years and studying the business strategies of current leaders in the space can be instructive to executives and investors everywhere.
Not only do India (MakeMyTrip) and Latin America (Despegar) have the potential to be major travel markets, but both have representative companies with public filings, allowing us a detailed look into these businesses that would be near impossible to get for many other regional online travel agencies.
India-based MakeMyTrip is struggling to turn a profit but looks to be set up nicely by favorable economic and demographic trends. On the other hand, Argentinean Despegar, which services all of Latin America, turns a respectable profit, but faces gathering economic clouds. Yet it too, has long-term demographic tailwinds, if it can weather the developing economic storm.
Despite superficial and geographic differences, these two companies have much in common. To name just a few, both are the reigning online travel champions in their respective local markets, have decades of operating experience, do business in highly fragmented markets with relatively low online penetration, and are listed on major U.S. exchanges.
The top lesson we learn is how much care must be taken when localizing a travel offering. Both MakeMyTrip and Despegar are highly evolved to match their regional niches. What works in the U.S. or Europe cannot be copy-pasted to new markets.
For instance, cancellation fees are a major hang-up to the Indian consumer, leading MakeMyTrip to offer two loyalty programs, one of which is a subscription-based program that offers free trip cancellations to members. Or consider Despegar, which offers interest-free installment plans to allow its cash-constrained shoppers to purchase travel on credit.
These are just a couple of the market-specific tactics that we detail in this report. Plus, for analysts, investors, and travel executives who are interested in the two markets, we have gone through a complete tear down of these companies’ financial statements and business models.
We recognize that many other emerging market case studies beyond those we touch on are worth studying. For instance, we hope to be able to publish reports on Traveloka in Southeast Asia or Jumia Travel in Africa in the future, though for now we are constrained by a lack of public information. Skift Research subscribers interested in China can refer to our extensive library of prior reports including, A Deep Dive into Ctrip and the China Online Travel Market, Best Practices for Attracting Chinese Outbound Tourists, and WeChat Marketing Strategies for Global Travel Brands.
The following two sections profile MakeMyTrip and Despegar. Each follows the same basic structure:
- Market Overview
- Company Description
- Business Segments
- Corporate Strategy
- Region-Specific Initiatives
- Financial Analysis
MakeMyTrip
Indian Travel Market Overview
According to the World Bank and the India Ministry of Tourism, 21.9 million outbound tourists traveled from India in 2016, the last complete year for which we have data available. The market has shown tremendous growth, considering that just 3.5 million tourists traveled from India 20 years before. By absolute numbers, this makes India the second-fastest growing outbound travel market.
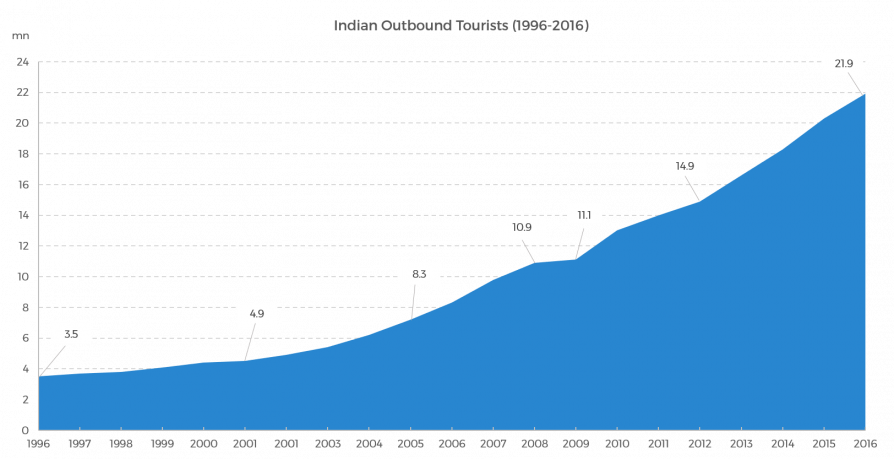
Source: World Bank and India Ministry of Tourism
Clearly, the Indian outbound travel market is already sizable, but it’s potential for growth is still huge. The 2016 total of 21.9 million makes up just 1.6% of the country’s population, and is just 1.3% of the total global outbound travel market, even though India is home to 18% of the world’s population. The UNWTO estimates that the number of outbound tourists from India will reach 50 million by 2020.
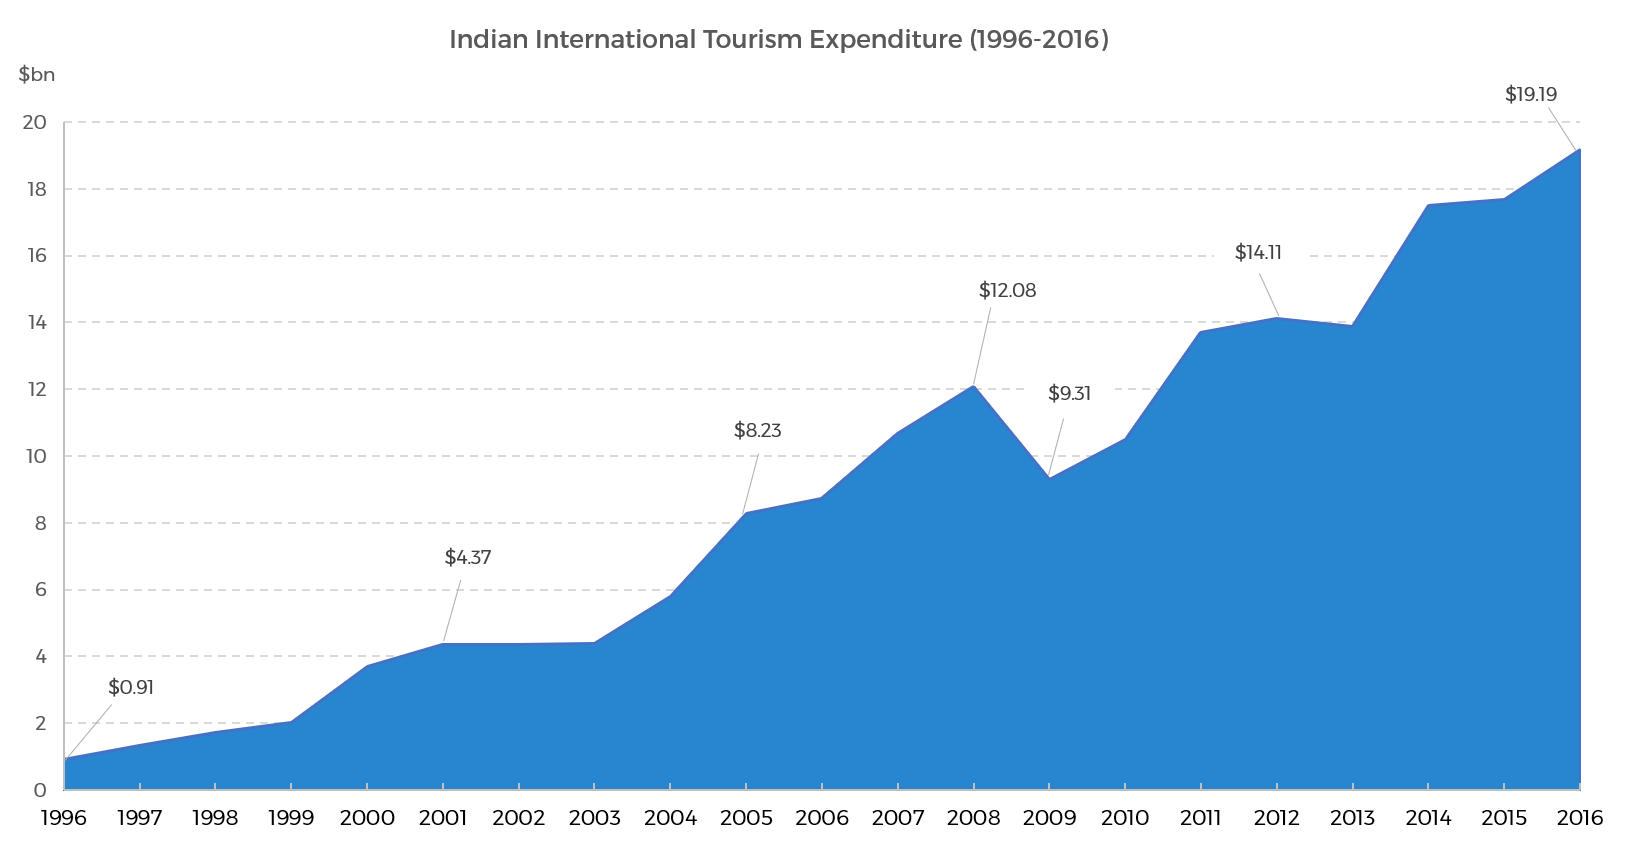
As the market grows in size, so will its expenditure. According to the World Bank, Indian outbound travelers spent $19.185 billion on outbound tourism related expenses in 2016. This puts it in the top 20 countries in terms of outbound tourism expenditure according to the World Tourism Organization (UNWTO). Even so, the average per-person, per-visit expenditure is just $876, which is low compared to other emerging and developed markets. We can see, however, that this amount is likely to grow over time with the market.
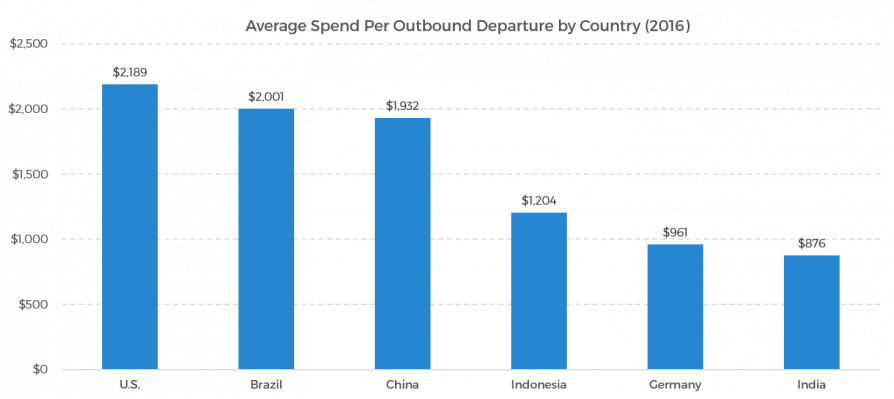
Source: Skift Research, The World Bank
From 2006 to 2016, India’s outbound tourism expenditure increased 7% on average year-on-year (YoY), and this rate is increasing. From 2015 to 2016, the market saw an 8.5% increase in expenditure. This was higher than the rates China, Indonesia, Brazil, the U.S., and Germany experienced in the same period (4.5%, 2.5%, -16.5%, 7.1%, and 2.5% respectively). If the India outbound tourism market grows as quickly as forecasters like the UNWTO estimate, we can expect that the market’s expenditure will also increase rapidly.
Economic Growth
According to the International Monetary Fund (IMF), India was the fastest growing major economy in 2016 with GDP growth of 7.1%, and it is expected to retain this position for at least the next five years. Individuals have also experienced economic benefits of this growth. A report by CAPA India and Expedia indicates that India’s high-income and upper-middle income populations grew 15.6% on average from fiscal year 2010 to 2015. In general, India’s per capita income is growing. In 2017, India’s GDP per capita was $1,940. Forecasts by Trading Economics estimate that this amount will increase to $3,500 by 2020.
Despite the overall economic growth, a high amount of income disparity still exists in India. A report from Oxfam reported that the richest 1% of Indians owned 73% of the national income in 2017, up from 58% the previous year. This inequality impacts the way the travel industry develops and operates in the country.
A Young Population
The population of India is very young compared to other major outbound markets. According to the 2016 Indian Census, about half of the country’s population was under 25 and two-thirds were under 35 that year. This population distribution set India up to have the world’s largest workforce by 2017, with about one billion people between 15 and 64 years old. By contrast, other major outbound markets like China, the U.S., Korea, and many countries in Europe have aging populations.
Internet Use and Penetration
According to a report by the Internet and Mobile Association of India (IAMAI) and Kantar IMRB, there were 481 million internet users in India in December 2017, which was 11.34% more than one year prior. The report forecasts that the number will have reached 500 million in June 2018. These signs of further penetration are promising, but for the time being, the internet has only reached about 35% of the country’s population. This puts India behind 10 other Asian countries in ranking internet penetration in the region according to a report by UNWTO and Global Tourism Research Centre (GTERC).
Company Description
MakeMyTrip (MMYT) is the largest online travel company in India, selling air tickets, hotels and packages, rail tickets, bus tickets, car hire services and ancillary travel services.
MakeMyTrip offers customers access to all major domestic full-service and low-cost airlines operating in India and all major airlines operating to and from India, over 55,000 domestic accommodations in India, over 500,000 hotels and properties outside India, Indian Railways and over 2,400 bus operators, including several major Indian and Singaporean bus operators.
Over the last 12 months, MakeMyTrip facilitated over $4.5 billion of gross bookings which generated $606 million of revenue on an adjusted basis. In its most recent quarter ended June 2018 (FQ1 2019 / CQ2 2018 — MMYT has a March 31 fiscal year end), MakeMyTrip received 204 million unique visitors to its websites and has logged 33 million customer transactions since inception.
Chairman and Group CEO Deep Kalra founded MakeMyTrip in 2000 with an eye toward non-resident Indians in the U.S. booking air tickets to India. The company found success as it expanded into the fast-growing domestic Indian travel market in September 2005. It then added service in the United Arab Emirates, which has a large non-resident Indian population, in 2009, and has since moved into Singapore, Malaysia, and South America. Despite its original focus on Indians residing in the U.S., and recent expansion plans, the India market generated 96% of company revenue for the 2018 fiscal year.
MakeMyTrip went public in 2010 and has continued to transform itself, most recently with the January 2017 acquisition of Ibibo Group, which bolstered its leading position in hotels and flights and jump-started its presence in bus ticketing.
MakeMyTrip further operates, either directly or through franchisees, over 34 branded travel stores which primarily sell travel packages. It also maintains offline hotel booking centers under the Goibibo brand to service the offline budget hotel segment. It has a network of 3,200 travel agents that sell MakeMyTrip products and 20,000 that sell RedBus tickets.
Business Segments
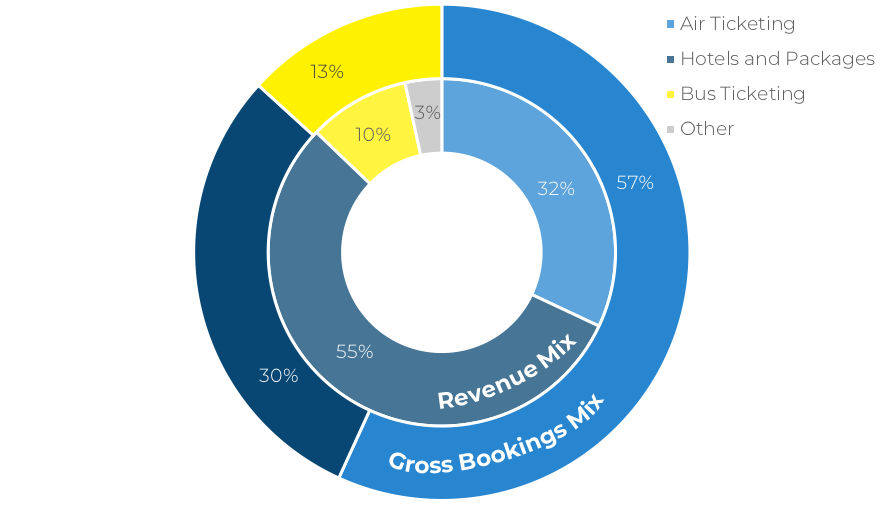
MakeMyTrip operates in four segments: Air Ticketing, Hotels and Packages, Bus Ticketing, and Other. As of FQ1 2019, Hotels and Packages accounted for 55% of revenue, Air Ticketing was 32%, and Bus Ticketing 10%.
Source: Company filings, Skift Research. Data as of June 2018.
Hotels and Packages
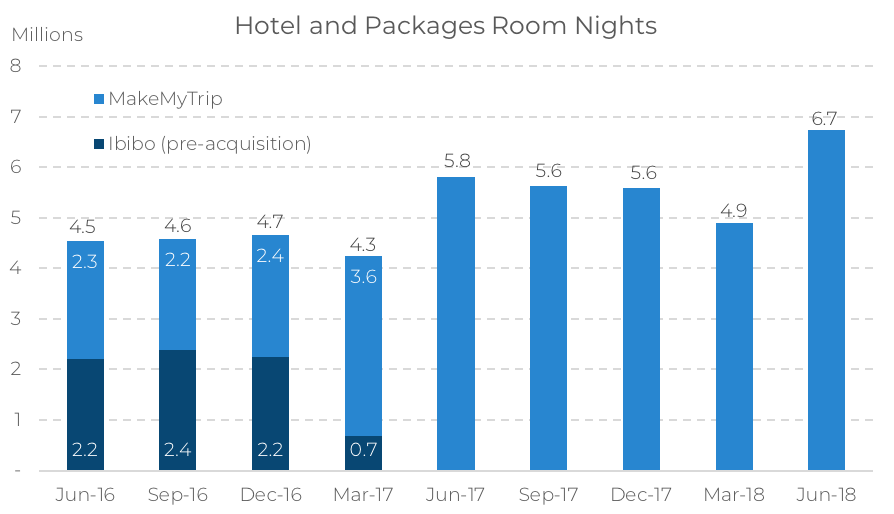
MakeMyTrip is a leader in online booking of hotels for the Indian market. Over the last 12 months, the platform sold $1.44 billion of hotel and package gross bookings and 22.9 million room nights. MakeMyTrip offers over 55,000 accommodations in India and over 500,000 hotels and properties outside India.
In 2017 it is estimated that the company owned 63% of the Indian online hotel bookings market.The economics of hotels are favorable and so this segment accounted for 55% of adjusted revenue despite making up a smaller share — 30% — of company-wide gross bookings. Accordingly, MakeMyTrip is looking to expand in this segment and its most aggressive move to date has been the acquisition of the Ibibo group and its Goibibo brand. Following the deal, the MakeMyTrip brand is being positioned as a premium offering, while Goibibo targets value conscious customers.
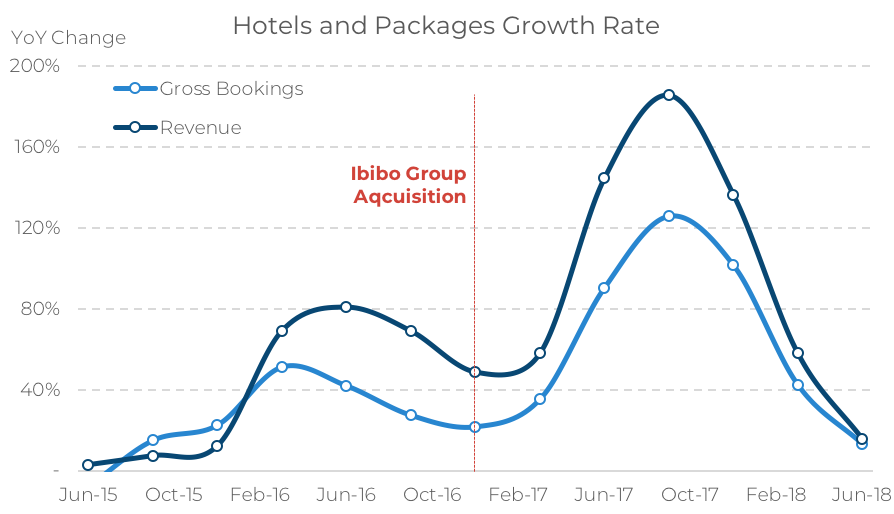
The Ibibo acquisition immediately boosted growth rates; hotel and package adjusted revenue, which had risen 65% in 2016, shot up 132% in 2017. However, as MakeMyTrip laps impact of the deal, its growth rates returned to earth, decelerating to a 15% YoY pace in FQ1 2019. We note that this is not strictly attributable to the law of large numbers. For instance, gross bookings decelerated in absolute dollar terms as well. FQ1 2019 increased by $50 million year-on-year versus a $91 million Y-o-Y increase in FQ4 2018 and $178 million in FQ1 2018.
Source: Company filings, Skift Research, Data as of June 2018.
Source: Company filings, Skift Research, Data as of June 2018.
The recent bookings and revenue deceleration admittedly raised eyebrows on the Skift Research desk, but for now we are taking a wait-and-see approach to this trend. For starters, recent weakness in the rupee was a drag on the latest quarterly results. Hotel revenues would have grown 20% YoY in FQ1 ‘19 on an FX-neutral basis, as if the rupee had not depreciated.
Secondly, we continue to see a lot of headroom for MakeMyTrip to grow in this market as online penetration of hotel bookings is low in India. Morgan Stanley estimates that only 10–15% of hotel bookings are done online compared to 25–30% in China, and 40–45% in Europe and the U.S. The Boston Consulting Group estimates that India’s online hotel booking share could double to 30% by 2020. This, combined with increased consumer propensity to spend on travel, should prove a growth engine for hotel bookings in quarters and years to come.
Air Tickets
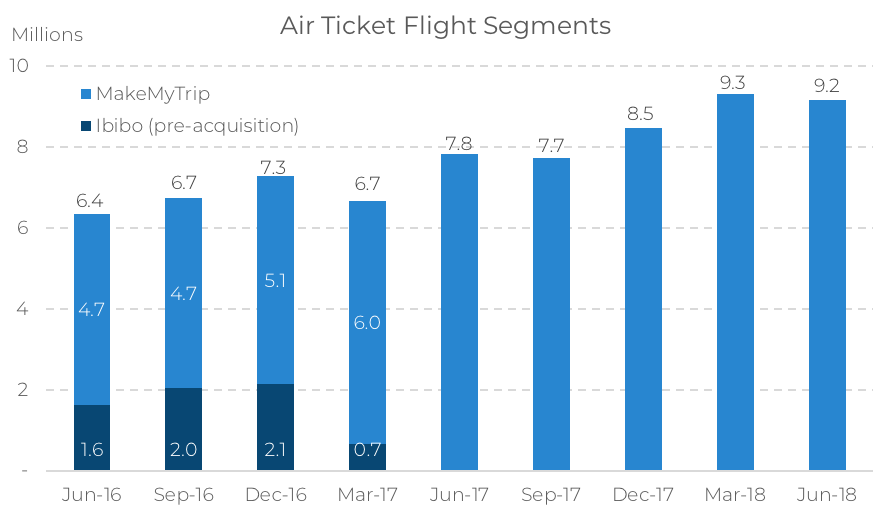
MakeMyTrip is also the travel website to beat in the Indian air ticketing market. Over the last 12 months, MakeMyTrip booked $2.86 billion of air tickets across 34.7 million flight segments. Air tickets make up 57% company-wide gross bookings, but low commission rates mean that this translates to a more modest 32% of adjusted revenue.
Source: Company filings, Skift Research, Data as of June 2018.
MakeMyTrip estimates that it has 64% share of the domestic OTA air ticketing market. The next closest competitors, Yatra and Cleartrip, have just 12% and 10% share respectively. Like what we saw with the hotel and packages segment, the Ibibo acquisition also improved air ticketing growth. However, relative to hotels, the growth boost was not as significant initially, and the post-deal hangover was less severe. Consider that air ticket gross booking grew 12% in 2016 as a baseline, 72% in 2017 with the help of Ibibo, and has settled in at 24% in the most recent quarter.
In absolute dollar terms, Airline bookings grew by $155 million year-on-year in FQ1 2019 versus a $287 million YoY increase in FQ4 2018 and $281 million in FQ1 2018.
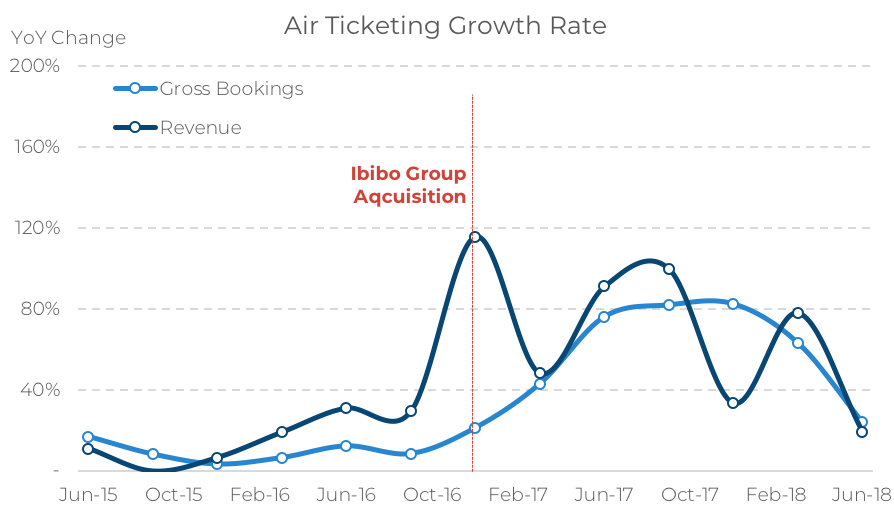
Source: Company filings, Skift Research, Data as of June 2018.
The intra-India air travel market is particularly important for MakeMyTrip which processed 13.7 million domestic transactions in fiscal year 2018 compared to 1.5 million outbound flights. Fortunately, this market continues to grow rapidly. The Indian Directorate General of Civil Aviation reports 117.2 million domestic air passengers in 2017, up 17% year-on-year and projected by CAPA to grow by 18–20% in coming years. These trends are being fueled by the continued proliferation of low-cost carriers (LCCs have 67% domestic market share up from 51% five years ago), new initiatives like the UDAN regional connectivity scheme to make air travel to and from smaller cities more frequent and affordable, and the overall increase in Indian per-capita wealth. We note that this is our long-term view for the air market, though there may well be obstacles in the short-term.
We expect MakeMyTrip will continue to hold its leading position in online air ticketing and is well-positioned to capitalize on both the domestic and international Indian air opportunity.
Bus Tickets
For a while it looked like MakeMyTrip had missed the bus on this market, having sold just 0.24 million and 5.5 million bus tickets in fiscal years 2016 and 2017, respectively. But its acquisition of Ibibo, which brought with it Indian bus ticketing platform RedBus remedied the situation. Bus tickets sold skyrocketed to 39.6 million for fiscal year 2018.
Bus tickets is now the fastest growing segment for MakeMyTrip. In FQ1 2019 the company sold $187.6 million in gross bookings of bus tickets, up 50% year-on-year. This ticket volume translated to $16 million of revenue, 10% of the overall corporate mix, and up 44% year-on-year.
Buses are an important means of transport in India and the market for reserved intercity bus tickets is worth an estimated $3.5 billion in bookings. Yet online penetration is still relatively low — 40% for private bus companies and just 10% for government-operated buses. The public sector is an important player in this market and many regional governments operate bus lines. The federal Indian government is pushing many of these regional transportation companies to digitize, which should play right into MakeMyTrip’s hand, given its scalable online and mobile platforms.
Further, RedBus has operations in Southeast Asia and Latin America, which are similar in that they have a highly fragmented, mostly offline, base of bus ticket sellers.
All in all, this still-new segment could provide substantial opportunities for growth for MakeMyTrip.
Corporate Strategy
The Indian travel market is rapidly evolving and MakeMyTrip faces threats on many fronts. Online travel giants Bookings, Expedia, and Agoda are all “fairly active” in the Indian premium hotel market, according to Kalra. Homegrown competitors, such as Yatra and Cleartrip, trail MakeMyTrip for now, but are racing to catch up. In fiscal 2018, Yatra sold $1.4 billion dollars of air and hotel gross bookings to MakeMyTrip’s $4.1 billion, while Cleartrip sold 1.5 million room nights to MakeMyTrip’s 21.2 million.
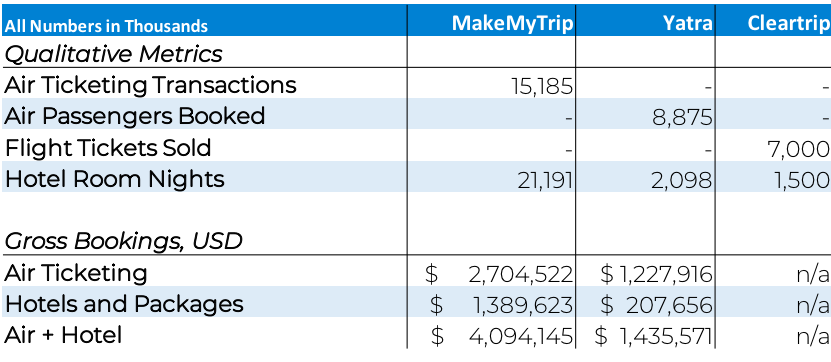
Source: Respective company filings and press releases. MakeMyTrip and Yatra data are both for their latest full fiscal years ended March 31, 2018. Cleartrip does not report dollar bookings. The exact date for Cleartrip’s qualitative metrics is not available, but we believe it is for its latest full operating year. All three companies report different qualitative air ticketing metrics. While we believe these figures are broadly comparable, there may be slight difference in methodology. Accordingly, we reproduce these metrics as presented by the companies themselves.
Kalra notes that unlike in the U.S. and Europe, supplier direct-to-consumer initiatives are relatively immature in India. On the hotel front, direct supplier competition is mostly limited to higher-end chains. Direct booking initiatives are growing however, especially in the air market, led by low-cost carriers. No doubt this strategy will grow in prominence, just as it did in mature markets.
In this section, we detail some of MakeMyTrip’s strategies to maintain its edge in this competitive environment.
Customer Acquisition
Customer acquisition is at the very heart of what makes an online travel agency successful and MakeMyTrip is no exception. It spent a massive proportion of its revenue on sales and marketing — 88% over the last 12 months vs. 53% and 34% at Expedia and Booking Holdings, respectively.
Expedia and Booking Holdings have traditionally spent billions on advertising, much of it in online performance channels such as Google, Facebook, and metasearch sites. At first glance, MakeMyTrip might appear to be similar given it devotes an even greater share of its revenue to marketing. And true, MakeMyTrip buys plenty of online and offline ads. But what is most interesting to us is how MakeMyTrip stands out, which is the fact that a large chunk of the company’s marketing budgets go toward innovative programs focused on discounts and loyalty rewards.
Discounts vs. Performance Advertising
For instance, consider online performance advertising. The single greatest expense line item at the world’s largest online travel agency, Booking Holdings, is performance advertising, a category that includes search engine and metasearch advertising. Booking Holdings spent 78% of its aggregate sales and marketing budget on performance ads in the last quarter.
Now contrast that with MakeMyTrip. In the same quarter, 62% of its sales and marketing expenditure — $92 million — went towards promotional expenses. The MakeMyTrip accountants define this marketing program as “upfront cash incentives and select loyalty programs cost.” Our plain English translation: coupons and credits, though this risks oversimplifying.
Nevertheless, a quick check of the MakeMyTrip website reinforces our intuition that MakeMyTrip invests significantly in customer discounts.
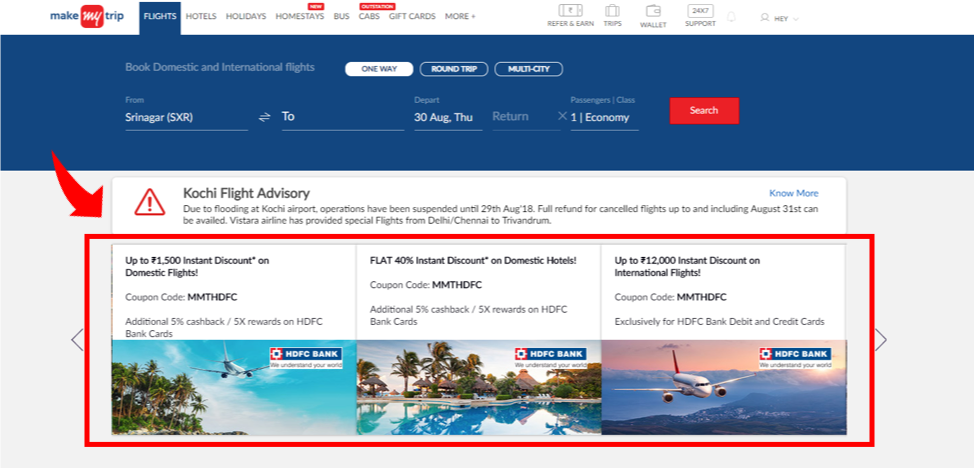
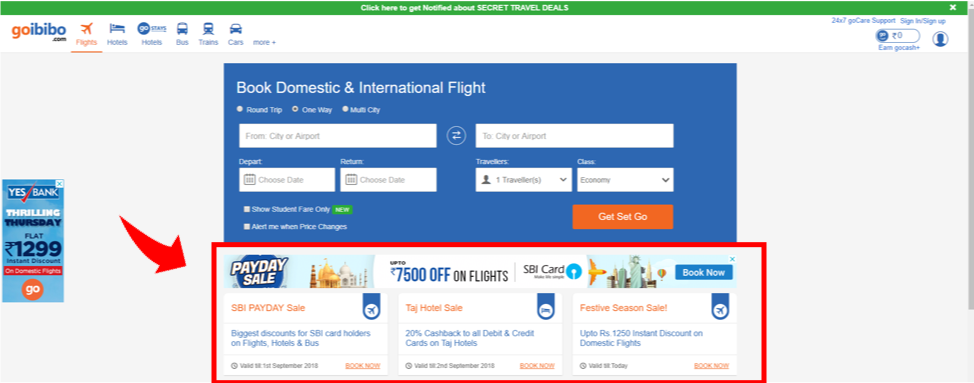
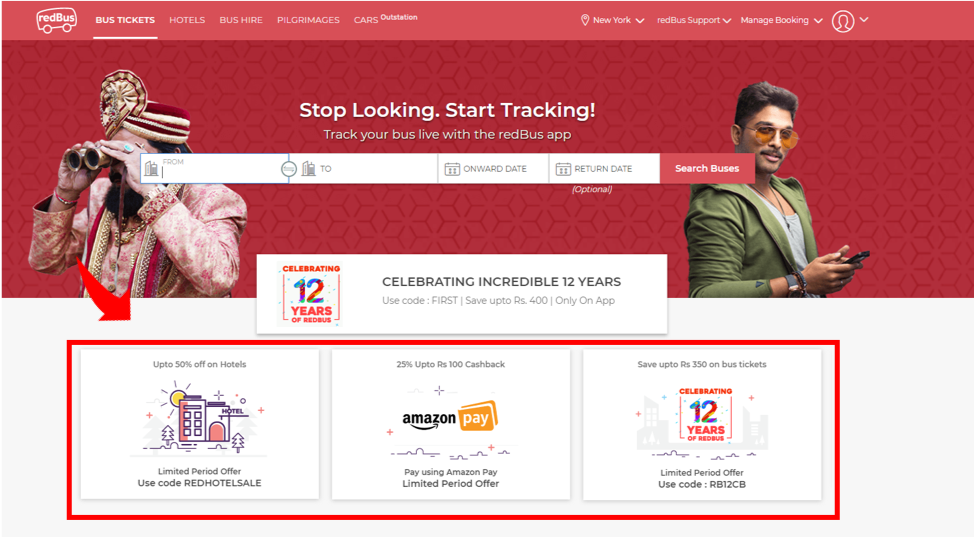
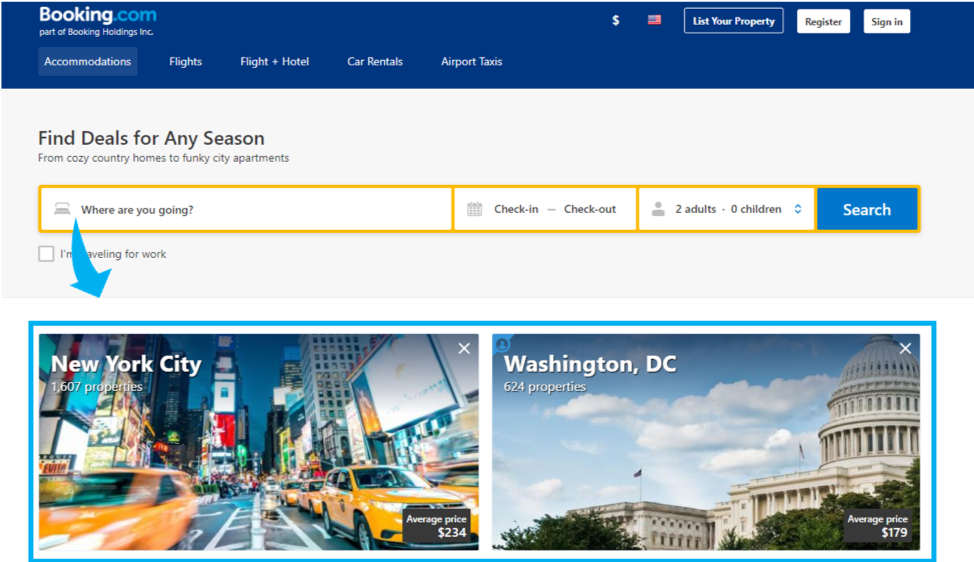
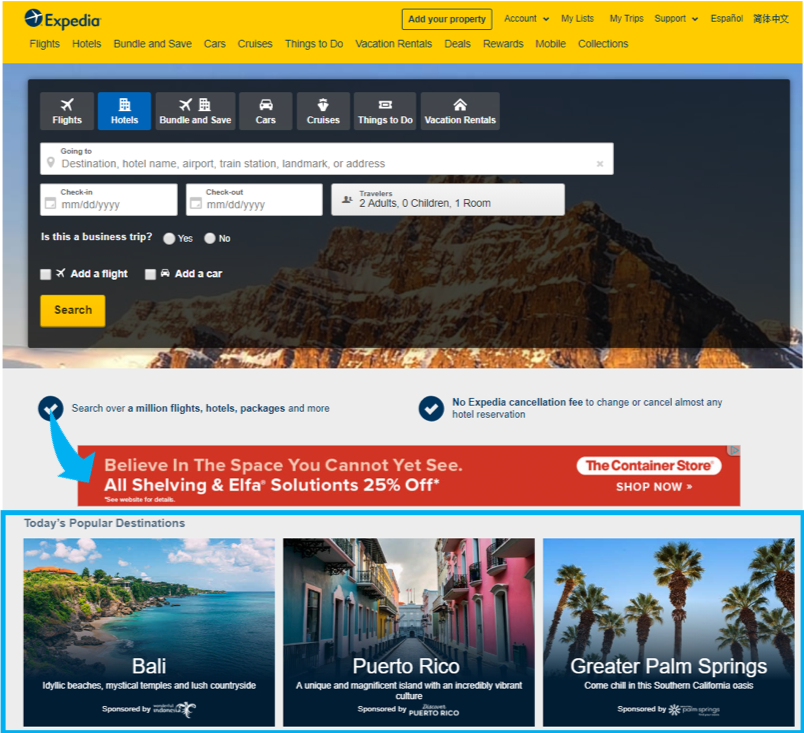
To wit, MakeMyTrip takes the most valuable “above-the-fold” space on its flagship desktop website and devotes it to coupon codes and cashback offers. In fact, all the company’s major brand websites — Makemytrip.com, Goibibo.com, and Redbus.in — use the same three deal carousel design on their landing pages.
This stands in contrast to Expedia.com and Booking.com which use the same digital real estate to display popular destinations. Below, we highlight the MakeMyTrip discounts in red versus the Expedia/Booking destination prompts in blue.
Exhibit 10: Home pages of respective online travel sites demonstrating different customer engagement designs in India versus the U.S. and Europe
Source: Respective company websites accessed August 2018.
It is interesting to note that the calls to action in the Indian market are more transactional and less tied to any particular location, whereas U.S. and European advertising is far more inspirational and destination driven.
We don’t mean to imply that MakeMyTrip does not invest in search engine marketing or that Expedia has never offered a coupon before. But the differences in approaches speak to the varying customer types. In the U.S. and Europe, the challenge that online travel agencies optimize for is how to get customers to land on their site. Once on the booking page, these customers have a higher propensity to spend online and are more open to browsing a variety of destinations. Whereas in India, MakeMyTrip is solving for how to lower the threshold for a customer to transact. This customer may well already have a destination in mind and be more value conscious. They may also be shopping from a mobile device, a medium in which transactions can be more price sensitive (the discounts appear on mobile as well, but with a different design layout).
Loyalty Programs
A recent development in MakeMyTrip’s customer acquisition strategy is its newly launched loyalty programs. Most interesting to us is that MakeMyTrip chose to launch two complementary programs rather than one integrated offering.
The first of these, MMT Black is made available by invitation only and has no cost associated with enrollment. It functions much like a traditional loyalty program in which members earn credits toward future travel with each purchase. The invitation-only aspect is an interesting twist that adds a veneer of exclusivity to the program, though our checks indicate that the program is fairly accessible in practice.
The second program, MMT Double Black, is built on an annual subscription model. Members enroll for an annual INR 2,499 fee and receive five free trip cancellations in return. When interviewed by Skift Research, CEO Kalra acknowledged that the program borrowed some from Amazon Prime (a model which Skift Research has advocated for in travel as well) and says it was inspired by research that found customers enjoyed booking online, but had a perception that cancellation charges would be very high. “This was a perception, perhaps from the past, when some people had burnt their fingers booking low cost carriers” he said. “We try to address that [by allowing customers to] actually cancel for free. I think we are chipping away at most of these ‘blockers’ to grow our base and it has worked out quite well.”
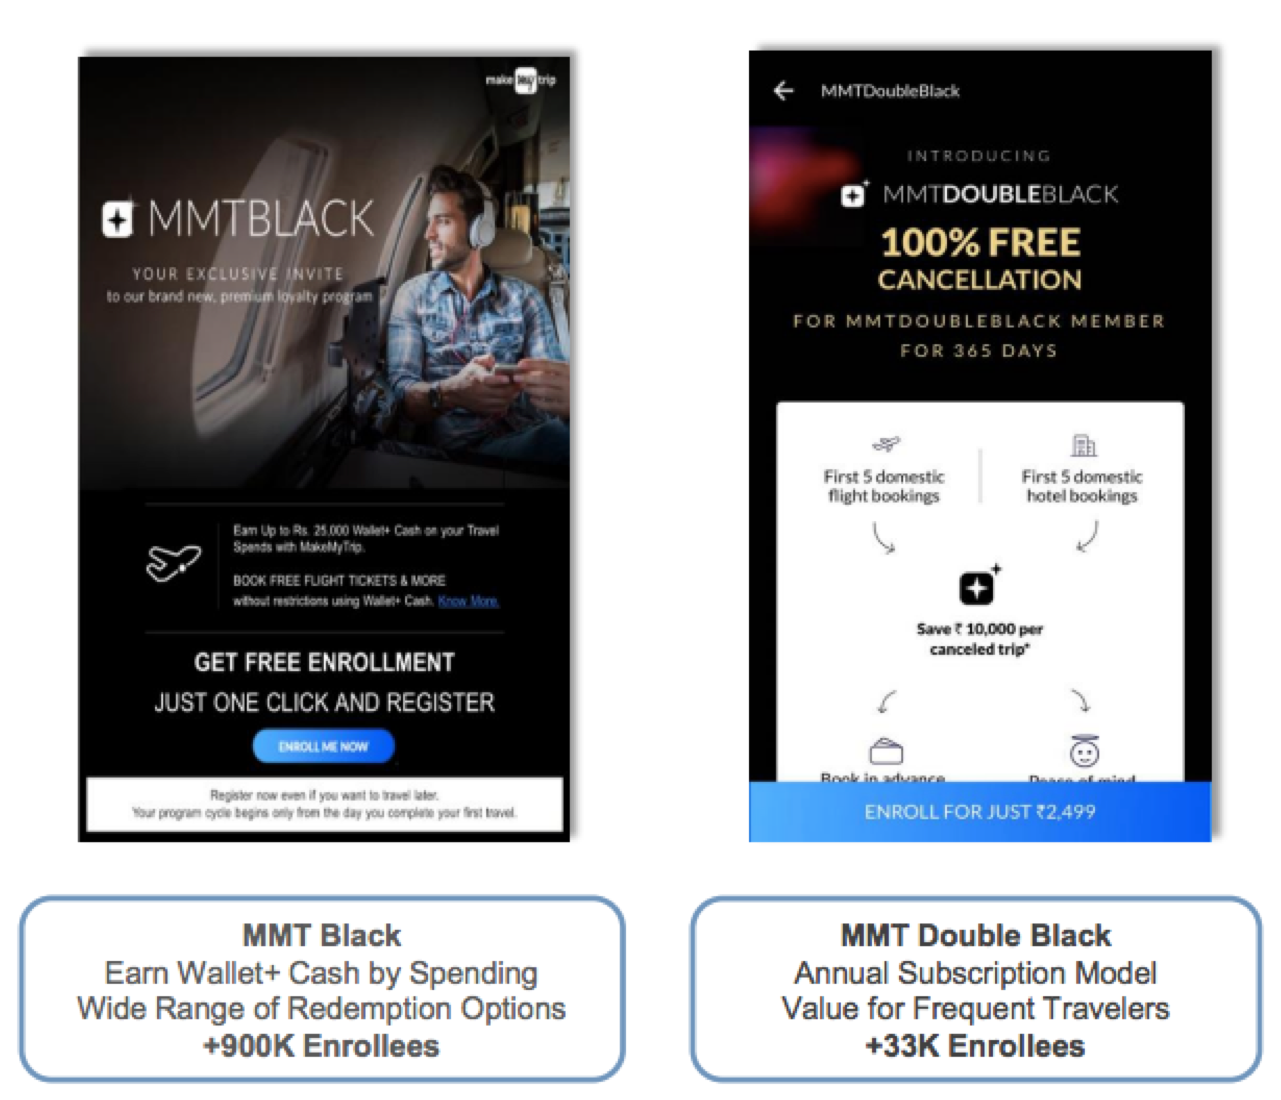
Source: Company investor presentation. As of September 2018.
Since their launch in July of 2017, both programs have scaled nicely and MMT Black now boasts 900,000 members; MMT Double has over 33,000. In March 2018, MakeMyTrip disclosed that Black members contribute 20% of corporate top-line and have repeat rates twice as high as non-Black members.
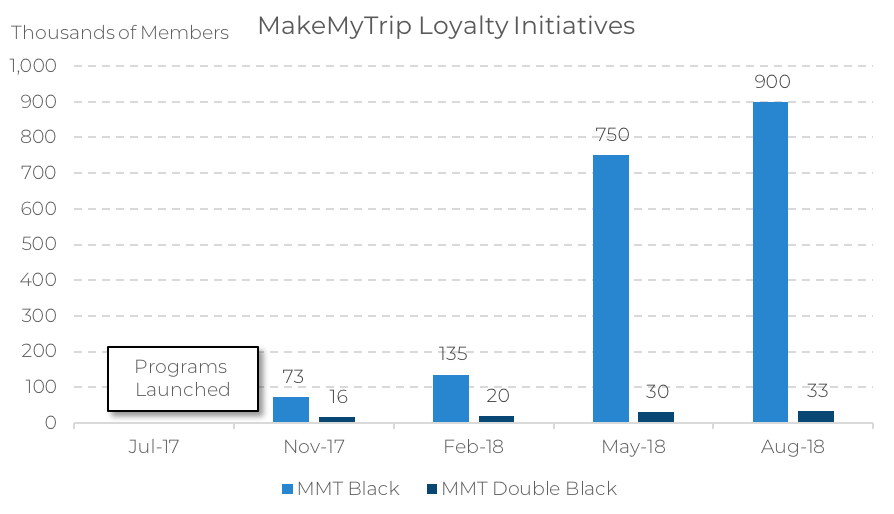
Source: Company filings. Data as of August 2018.
The company plans to continue investing in loyalty programs and has gained “invaluable customer insights” from them, CEO Kalra says. The latest expansion was the launch of a Goibibo loyalty initiative to encourage user generated content through gamification and travel credits.
Loyalty programs are nothing new, and MakeMyTrip pales in scale compared to Marriott or Delta which both boast over 100 million members. But we view MakeMyTrip as an incubator of loyalty innovation — from subscription models, to experiments with exclusivity and gamification. We will be watching future loyalty tests at MakeMyTrip with interest.
Region-Specific Initiatives
As an Indian travel specialist, MakeMyTrip built a toolkit to fit to the contours of its local market in unique ways. This includes strategies adapted for the mobile-first nature of India, its diversity of languages, and ways to build consumer trust.
The Importance of Mobile to the Indian Market
In India, mobile is the device of choice to access to the internet. Data from web analytics company StatCounter shows that by February 2017, 79% of internet use was accessed through mobile phones. The country has effectively leapfrogged the personal computer revolution of many developed nations and IAMAI and Kantar IMRB now estimate that India will have 478 million mobile internet users by June 2018. Out of a base of 500 million internet users, this equates to 96% mobile internet penetration.
Add to this picture the November 2016 demonetization that declared all high-value banknotes (500 and 1,000 rupees) to no longer be legal tender. The move was intended to eliminate counterfeit currency and cash that had been hidden to avoid tax payments.
It should be no surprise that the confluence of these two actions have propelled the growth of mobile payments. Mobile payment users increased over 75% from 32 million in 2016 to 56.2 million in 2017, according to eMarketer. Credit Suisse now forecasts digital payments in India will reach $1 trillion by 2023 from the current $200 billion.
As a result, MakeMyTrip also faces a unique competitive threat from emerging digital wallet and ecommerce platforms. Its enemy number one in this category is Paytm.
While a relatively recent development, Paytm is aggressively competing for bookings in flights, bus, and rail. In FY18 Paytm purported to sell 38 million bus, flight, and rail tickets and hopes to double that figure by the end of this fiscal year. For comparison’s sake, MakeMyTrip sold 39.6 million bus tickets alone and in FY18 likely sold upward of 56 million tickets once air and rail transactions are included in that figure.

Source: Company filings and news reports for fiscal year 2018, ended March 31, 2018. We use transactions as a proxy for air and rail tickets, which are not directly reported. We believe that this is conservative assumption as a transaction implies at least one ticket sold, but could potentially represent multiple tickets per transactions.
Paytm is mostly focused on the ticketing space, rather than accommodations. Hospitality was never the mobile wallet’s strong suit, and the sector has been an ongoing challenge for it. In May of this year, Paytm stopped showcasing hotels on its app and it was reported they it was dismantling the team (interestingly, these challenges mirror Amazon’s hotel struggle). Reports of the death of the Paytm hotel business may be exaggerated, however. In July of 2018, Paytm announced the $20 million acquisition of last-minute hotel booking platform NightStay.
So, the battle continues, but MakeMyTrip is far from defenseless in this space.
Its in-house mobile development efforts have been a priority and are paying dividends. MakeMyTrip found that users often uninstall travel apps after making a purchase. The challenge, it turns out, was that many Indian users had lower-end phones with limited storage space. Developers launched a lightweight version of the app called GoExpress which clocked in at just 1.5MB. At that size, even low-end users were able to keep the app installed.
MakeMyTrip’s mobile app has surpassed 129 million cumulative downloads as of June 2018 and sports 18 million monthly mobile active users.
Another response has been to partner with Flipkart, India’s largest e-commerce marketplace, which has over 100 million customers. In a deal struck in April of this year, MakeMyTrip will offer branded travel products from all three of its core brands on the Flipkart platform.
MakeMyTrip has also been integrating its offerings with Flipkart’s mobile payments and digital wallet subsidiary, PhonePe. At present, RedBus and Goibibo’s hotel suite are sold on PhonePe; Goibibo’s flight products will be added shortly.
The latest mobile efforts involve the deployment of artificial intelligence and chatbots as well as a WhatsApp integration.
India Presents Unique Language Challenges and Opportunities
There is an astounding amount of diversity across India’s estimated 1.3 billion population, but this presents unique cultural and language challenges for MakeMyTrip and others doing business in the country. Hindi is the most widely spoken language and the primary tongue for 41% of the population. In addition, there are 15 other official languages and even more unofficial dialects.
This represents a subtle, but critical, barrier to entry for foreign competitors and even some regional domestic competitors. CEO Kalra calls this both “a great challenge and opportunity for us.”
MakeMyTrip has an in-house translation and customer service teams for 12 different languages and offers its app in both English and Hindi. It plans to offer perhaps four or five additional app dialects in time.
“It’s easy to jump to conclusions, that ‘hey, we’ve seen the readership data out there and people know English so we don’t have to get into the local language,’” says Kalra. English is, after all, an official language in India and widely spoken in political and commercial contexts. “But we’ve found,” Kalra is quick to point out, “that [even for English-speakers] the affinity is much higher as you get into the local language.”
MakeMyTrip advertising now emphasizes that its apps are available in multiple languages. The localized Indian versions of both Expedia.co.in and Agoda.com load in English.
India’s Inconsistent Hospitality Infrastructure Erodes Consumer Trust
India’s hospitality infrastructure faces challenges, especially in smaller cities. he quality of local hotels can, and does, vary greatly. The lack of a standardized accommodation product and the resulting uncertainty is one of the biggest challenges that booking sites face in driving online sales. It explains why western travel agencies are limited to the high-end hotel market and has been a curb on MakeMyTrip’s domestic market growth.
In response, MakeMyTrip now offers MMT Assured Hotels. These are over 5,000 properties that have been certified by the company to meet certain standards and come with a 24/7 hotline that customers can call if they have problems after check in. Goibibo has a similar program, GoStays, that guarantees rooms offer amenities like A/C, Wi-Fi, and clean linens.
MakeMyTrip, in February 2018, also announced a partnership with OYO rooms. OYO, a unicorn startup founded in 2013 and backed by SoftBank and others, made a rapid ascent by guaranteeing quality rooms in India’s fragmented budget hotel market. OYO is a unique business model that operates as a soft brand-cum-tech platform for these hotels. It now offers over 8,500 hotels in 230 cities across India, all of which are ensured to have the same amenities and are bookable via mobile app.
MakeMyTrip is now able to offer select OYO inventory on its site, further expanding its presence in the budget and alternative accommodations market, while solving for the inherent quality challenges that would have otherwise come with that territory.
Financials
We turn now to MakeMyTrip’s financial results. To better inform this discussion, we review MakeMyTrip’s key accounting standards and its recent methodology change (FQ1 2019) in the optional text box below.
MakeMyTrip Accounting Standards
MakeMyTrip (MMYT) reports both an IFRS “reported” revenue figure and a non-IFRS “adjusted” revenue figure. Skift Research prefers the adjusted revenue figure and has used it throughout this report for two main reasons.First, in some transactions, MMYT will act as a principal, rather than an agent, when offering hotel rooms to its customers. MMYT is fully responsible for processing these transactions and may even have pre-purchased hotel rooms for its own inventory. It later remits payment for the rooms to its suppliers. These are effectively what Booking Holdings and Expedia would refer to as merchant transactions. This is in contrast with agent transactions where MMYT acts as a broker between its customer and the hotel, which processes the transaction and pays MMYT a commission.
The economics of these two transactions are effectively the same once the customer’s travel is completed. But from an accounting perspective MMYT recognizes the gross booking value of the hotel room as revenue and then takes a service charge to its expenses for the value remitted to the hotel in principal transactions. Whereas in agent transactions, only the commission is recorded as revenue and there is no matching expense. Principal/merchant transactions are also collected upfront, giving extra working capital to the MakeMyTrip to be used until payment to the hotel supplier is due.
This means that changes in reported revenue can reflect shifts in the mix of principal-to-agent sales as much as underlying growth trends. The adjusted revenue metric subtracts service costs directly from the top-line to solve this issue.
Secondly, on April 1, 2018, MMYT adopted the new revenue recognition standard IFRS 15. This new standard requires MMYT to reclassify certain customer promotional expenses from a market and sales costs to a reduction of revenue. These promotional expenses are related to “acquiring customers and promoting transactions across various booking platforms such as upfront cash incentives and select loyalty programs’ costs.”
MakeMyTrip adopted the new standard using the cumulative effect method which means the prior results were not restated. This effectively “breaks” year-on-year comparisons unless we adjust both revenue and sales and marketing by adding promotional costs back into each line item.
We provide our reconciliation of adjusted revenue and adjusted sales and marketing below. Note that promotional costs reached $92 million in FQ1 2019 versus a reported revenue of $137 million, so this is a significant figure. A failure to adjust these figures would result in an analyst calculating that revenue had shrunk 28% in FQ1 2019 over the prior year, when in fact, it had grown 20%.

Source: Company filings, Skift Research. Data as of June 2018.
Top-line Trends and FX-Impact
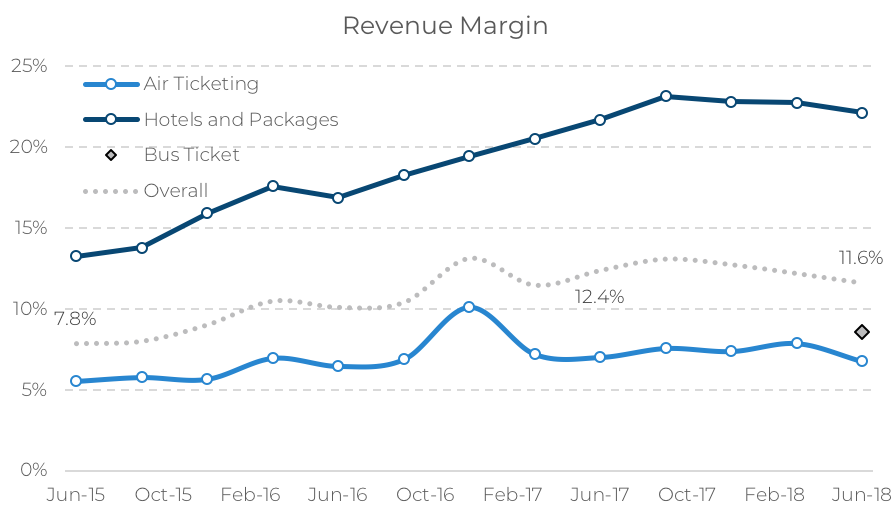
MakeMyTrip starts in a strong position with healthy commission take rates that had been steadily improving for many years as the company both a) shifted its mix toward the more profitable hotel segment and b) dramatically improved the commissions that it made on selling hotel rooms.
The business now has a world-class take rate of 11.6%, on par with Expedia, and a nice improvement from its 7.8% rate three years ago. Booking Holdings still commands a higher take rate of nearly 15% due to its higher mix of hotels. However, we see limited potential for MakeMyTrip to improve its revenue margin much further because hotel commissions have plateaued and bus ticket commissions are falling below the overall effective rate. This last bit means that bus tickets, MakeMyTrip’s fastest growing segment, should boost gross bookings and revenue, but will be dilutive to overall take rates.
Source: Company filings, Skift Research. Data as of June 2018.
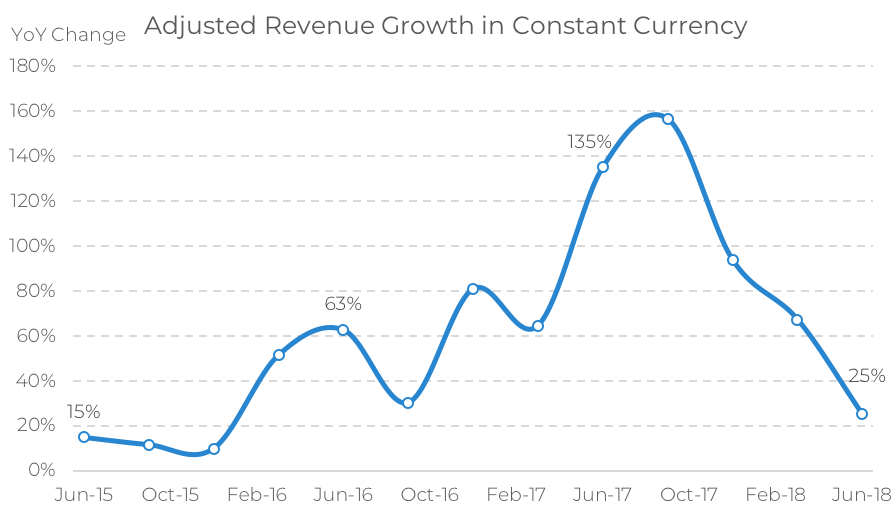
MakeMyTrip sales have decelerated as the company laps the impact of inorganic growth. Nonetheless revenue continues to grow at a respectable pace, up 25% year-on-year in constant currency terms in the most recent quarter. We are monitoring this trend closely as further deceleration in organic growth rates would be a cause for concern.
Source: Company filings, Skift Research. Data as of June 2018.
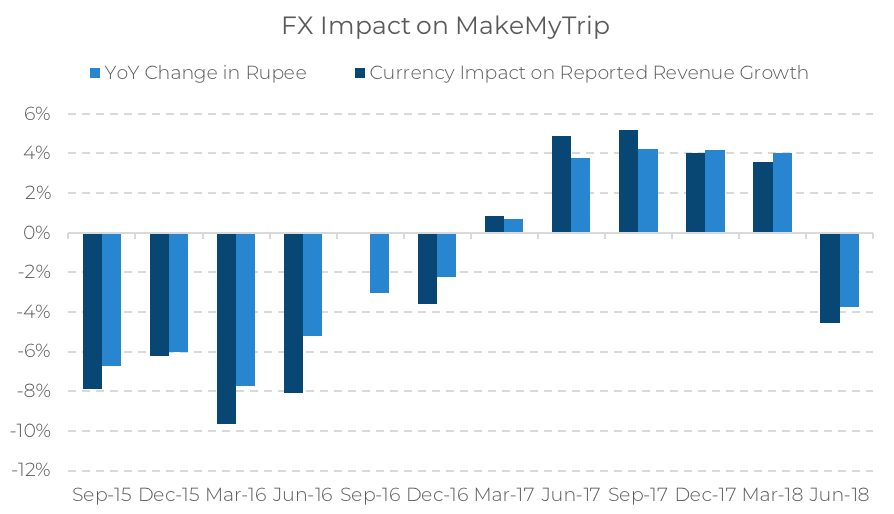
MakeMyTrip reports earnings in U.S. Dollars but the majority of its business is conducted in Indian Rupees. This means that when the rupee weakens, its U.S.-denominated results suffer from translation effects. A weaker rupee has the secondary effect of dampening Indian outbound tourism demand as well.
There is a very strong relationship between the year-on-year change rupee exchange rate for the quarter and how much boost or drag that FX provides to revenue growth as demonstrated by the below graph. After five quarters where the rupee aided revenue growth, it flipped to a hindrance in this latest quarter.
Unfortunately for MakeMyTrip, we believe that this headwind is only going to intensify. If the rupee were to hold at current rates, our estimates show it could be a meaningful detractor from revenue growth over the coming four quarters.
Source: Company filings, CapitalIQ, Skift Research. Data as of June 2018.
Profitability and Margin Analysis
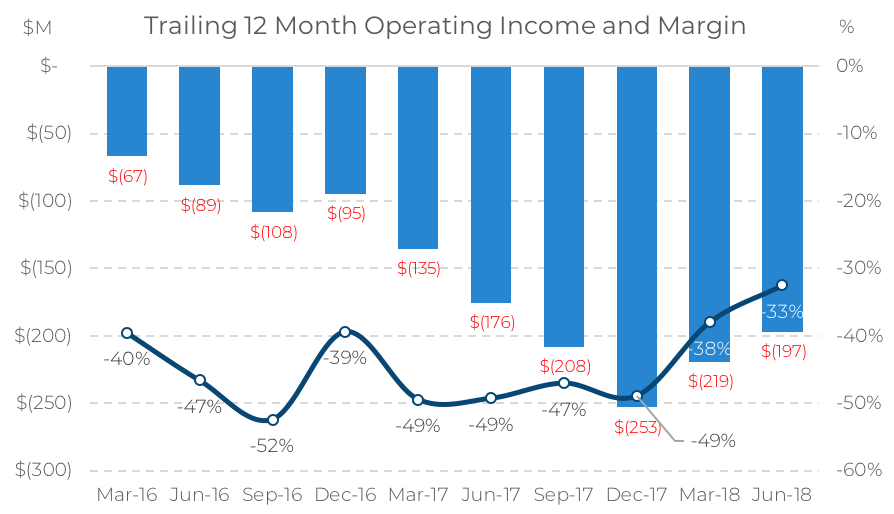
Over the last 12 month period, MakeMyTrip reported a $197 million loss on adjusted operating income. The company has long operated in the red, and this seems unlikely to change any time soon despite modest improvements in recent quarters.
Source: Company filings, Skift Research. Data as of June 2018.
The culprit, as is the case at so many other online travel agencies across the globe, is marketing expenses.
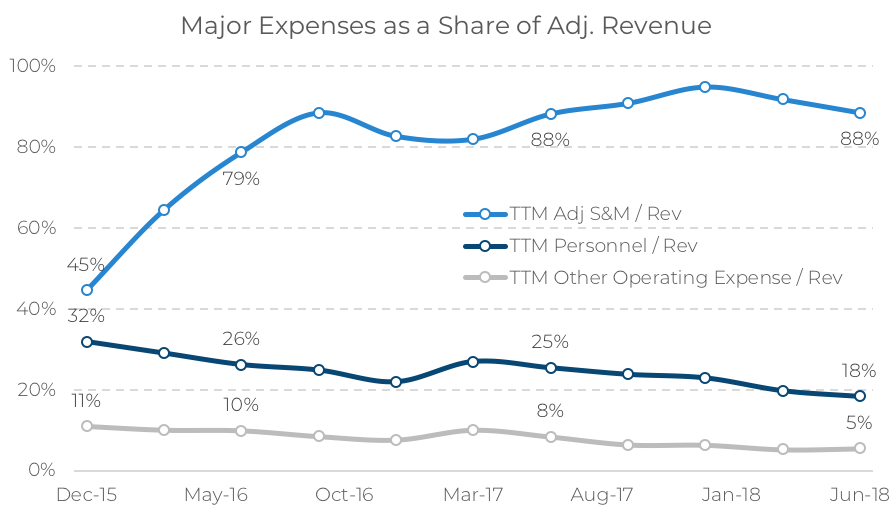
Encouragingly, MakeMyTrip has demonstrated the ability to create operating leverage in all its other line items. Its second largest expense after sales and marketing is personnel, which declined from 32% of adjusted revenue in December 2015 to 18% today. All other operating expenses besides Selling and Marketing (S&M) and personnel fell from 11% of revenue to 5% of revenue in that same time frame.
Source: Company filings, Skift Research. Data as of June 2018.
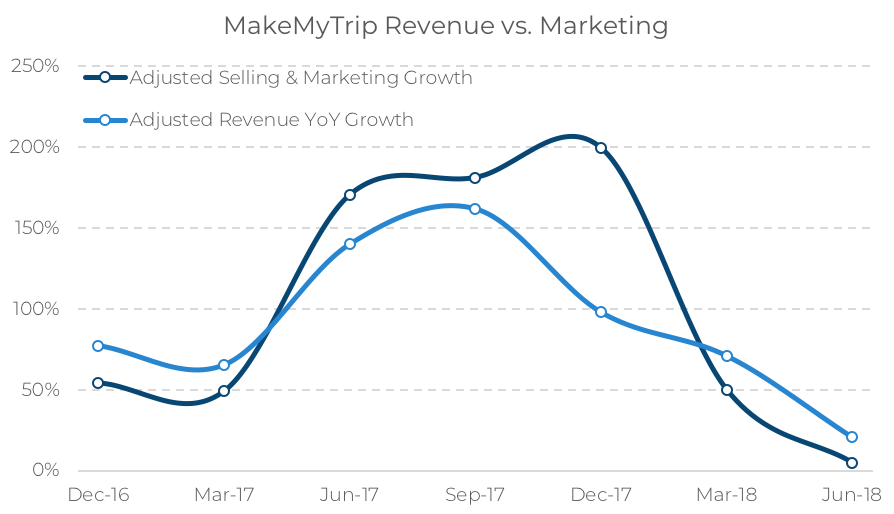
It is only sales and marketing expense that remains persistently high, an eye-popping 88% of revenue over the last 12 months. Marketing expenditures have held the same share of revenue, more or less, for the last two years.
The big question for MakeMyTrip will be whether it is trapped in a race to the bottom with its peers, or whether it can begin to achieve economies of scale and create marketing efficiencies. On the one hand, much of its marketing budget, as discussed above, is in the form of coupons. This type of marketing does not lend itself well to efficiencies over time. The competition is only getting tougher, making it difficult for MakeMyTrip to take its foot off the promotional pedal.
Yet, there are green shoots as, in the last two quarters, revenue grew faster than sales and marketing did, indicating that the company is gaining marketing leverage. MakeMyTrip’s new focus on loyalty should create efficiencies through higher repeat rates. Perhaps scale advantages are also finally starting to kick in as a result of the Ibibo acquisition compounded by rapid growth in the underlying Indian travel market.
The company was also given some room to breathe by Expedia, Bookings, and other global peers who pulled back on ad campaigns worldwide.
We will, as with so many other metrics, continue to monitor this one closely to determine if we are watching a trend or a fluke.
Source: Company filings, Skift Research. Data as of June 2018.
Despegar
Latin America Travel Overview
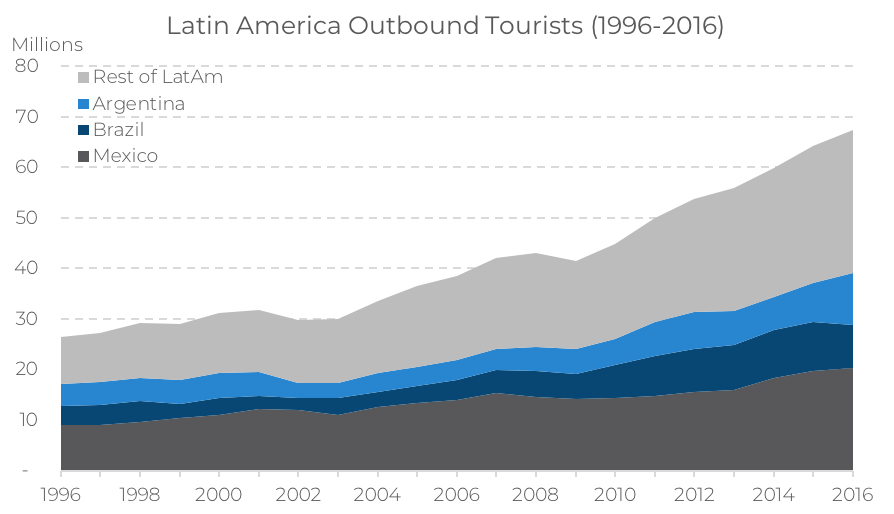
According to the World Bank, 67.4 million outbound tourists traveled from Latin America in 2016, the last complete year for which we have data available. The three largest individual markets were, in order, Mexico (20.2 million outbounds), Argentina (10.3 million), and Brazil (8.5 million).
Over the past 20 years, Latin America has added 41 million new outbound tourists, a respectable 4.8% compound annual growth rate (CAGR), behind only the growth posted in South and East Asian countries.
Source: World Bank, Skift Research. Data as of 2016.
Total outbound travelers represent just 11% of the region’s total population, according to World Bank data, leaving room for further growth as this trend continues to play out. That said, there can be quite a bit of dispersion at the country level. At the high end, outbound tourists account for 23% of Argentina’s population, in line with the same figure for the United States, and representing a relatively broad base of international travelers. On the other hand, outbound travel remains underpenetrated in Brazil, at just 4% of total population. Mexico sits in the middle, though above the region-wide average, at 16% of its population.
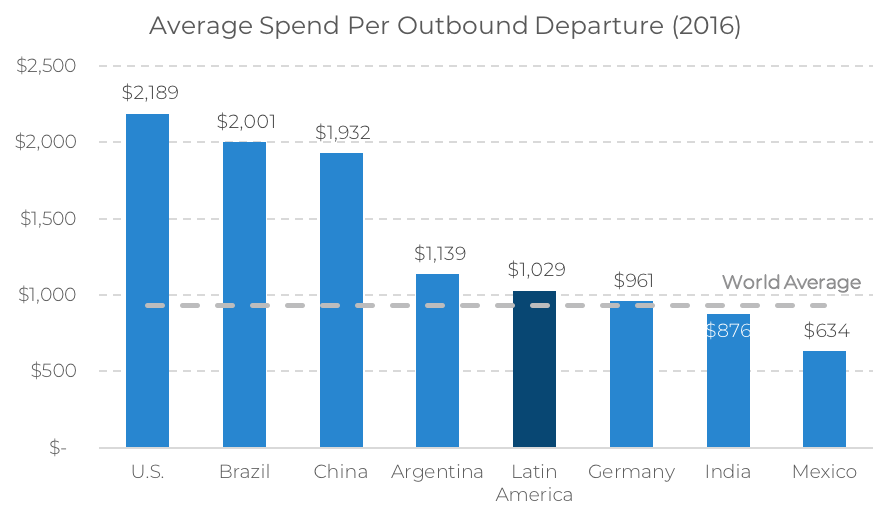
These disparities show up when measuring travel expenditures as well. The World Bank says that Brazilians, for instance, spend $2,001 per trip. This is one of the highest travel spending rates in the world, and, when coupled with the small share of the country’s population that travels internationally, suggests the wealthy upper-class is responsible for most trips. In contrast, the average traveler in Mexico spends $634 per trip.
At the average though, Latin American expenditures per trip are $1,029, in line with the worldwide average of $934, and leaving room for growth.
Source: World Bank, Skift Research. Data as of 2016.
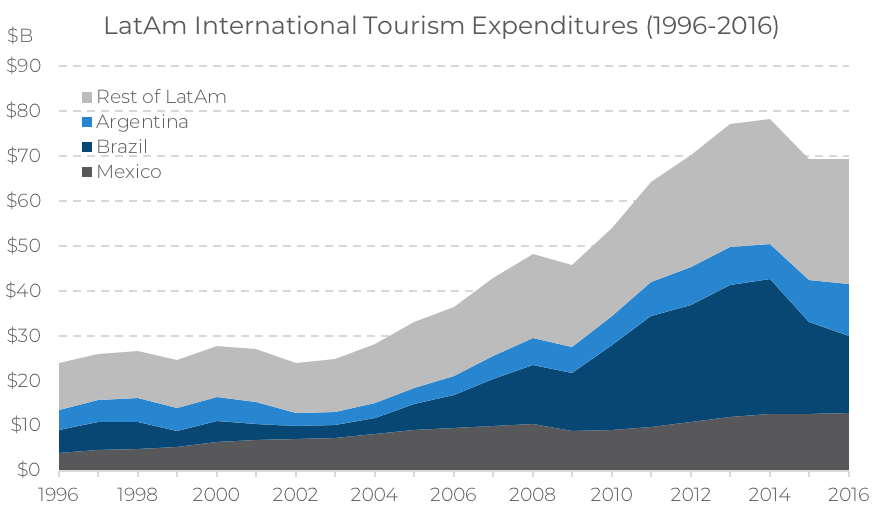
Aggregate outbound tourism expenditures in the region sum to $69.3 billion in 2016. Brazil was the largest contributor to this with $17.1 billion, followed by Mexico ($12.8B) and Argentina ($11.7B). While over the last 20 years, aggregate expenditures have grown at a solid 5.5% compound annual rate, the level of spending has been in decline since 2014.
Source: World Bank, Skift Research. Data as of 2016.
That is because both Brazil and Argentina, two of the region’s largest economies, entered into an economic recession in 2014. Argentina officially emerged from its recession in 2016 and Brazil in 2017. But both economies are still rocky and are being buffeted by currency weakness and unstable political climates. As we write this report, Argentina, in particular, seems to be on the cusp of re-entering a recession. We discuss the evolving FX situation in more detail further on.
Despite these near-term headwinds, we still see long-term potential for Latin America’s online travel market. The region is set to cash in on a demographic dividend that should boost growth and should also gain as a result of low but growing online penetration.
Online Travel Use and Penetration
Euromonitor estimates that online and offline Latin American travel bookings were a $99 billion market in 2017 and believes that it could grow to $116 billion by 2021. Breaking this down further, Euromonitor estimates that lodging represented $48 billion of this total and airlines $41 billion; tours and activities account for the remaining $10 billion.
The majority of the travel market is currently offline, and indeed Euromonitor estimates that Latin America has the lowest online travel penetration rate of any major region. It believes that today just 36% of the travel bookings take place online compared to 40% in Asia, 52% in the U.S., and 54% in Western Europe.
As a result, the online travel market is expected to grow even faster than the overall category. Online travel bookings for Latin America were estimated by Euromonitor to be $36 billion in 2017 and are forecasted to grow at a rapid 8.4% compound annual growth rate through 2021 to $49 billion.
All of this leaves online booking sites that cater to the Latin America substantial runway to grow for the foreseeable future.
Company Description
Despegar (DESP) is the leading online travel agency in Latin America. It operates in 20 countries, representing 95% of the region’s population. Key markets are Brazil, Argentina, Mexico, Chile, and Colombia. It operates as Decolar in Brazil and does business as Despegar, its global brand, in all other markets.
Despegar has supplier relationships with over 450,000 hotels and/or vacation rentals, 300 airlines, 1,000 car rental companies, 280 bus carriers, and 7 cruise lines. It works with 240+ in-destination partners who offer 7,700 activities. The company also has a network of 8,800 affiliates, including travel agents, online and offline retailers, and other travel providers, in seven countries across Latin America.
Despegar was launched as a site to book airline tickets online in Argentina in 1999. The next year, Despegar expanded to Brazil, Chile, Colombia, Mexico, and Uruguay. The company began selling hotels in 2009. It has since continued to shift toward a full-service online booking site with the addition of packages, cruises, and car rentals in 2012; vacation rentals and in-destination activities in 2013; and buses in 2016.
Early venture capital backers were Tiger Global Management (2007) and General Atlantic (2012). Expedia made an equity investment in, and signed a strategic partnership agreement with, the company in 2015. Despegar came public in September 2017 with a $332 million listing on the NASDAQ.
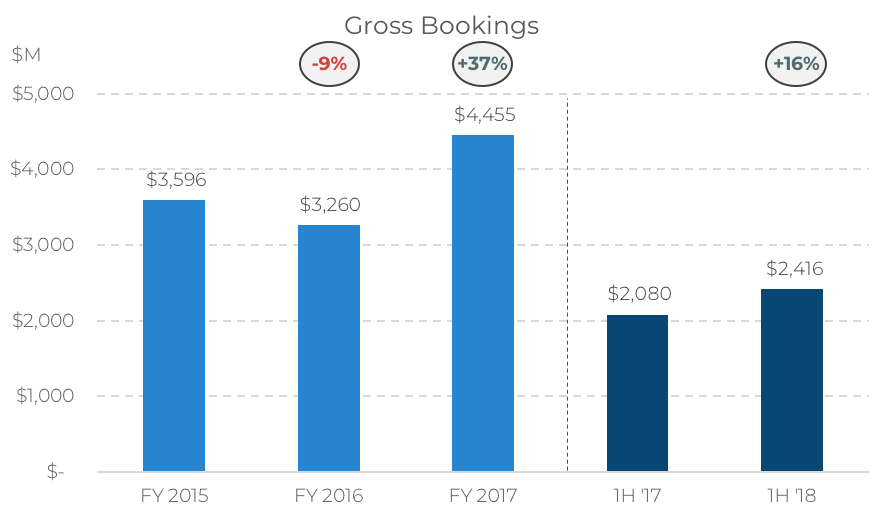
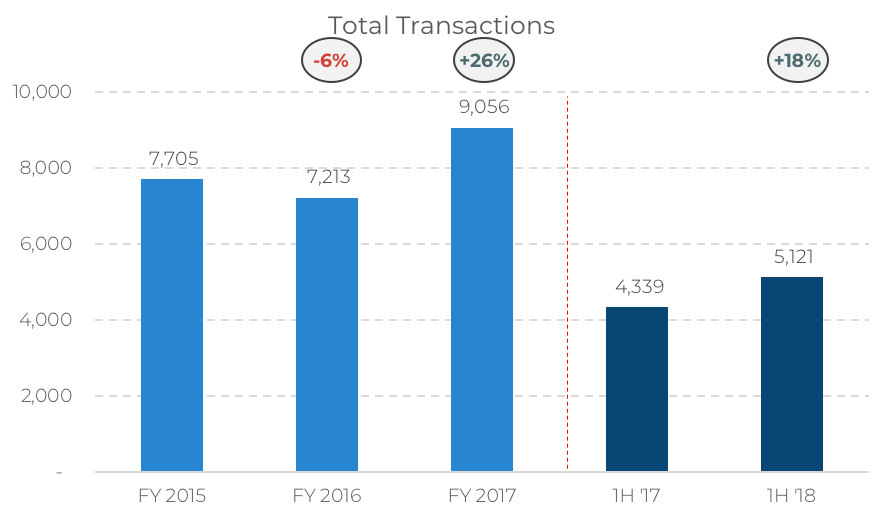
The company generated $4.79 billion of gross bookings from June 2017 to June 2018 across 9.8 million transactions. After declining in 2016, both of these metrics returned to growth in 2017 and the first half of this year. These bookings generated $561.2 million of revenue net to Despegar.
Source: Company filings, Skift Research. Data as of June 2018.
Source: Company filings, Skift Research. Data as of June 2018.
Brazil, where it does business as Decolar, is the firm’s largest market. For calendar year 2017 (which is also fiscal year 2017), Brazil represented 29% of revenue and 41% of transactions across the company. Argentina is the second most important market at 26% of revenue and 25% of transactions. As these numbers imply, Brazil is actually less profitable per transaction, it generates just $41 of revenue per transaction to Argentina’s $60, but it more than compensates for this shortfall with higher volumes. (We use FY 2017 data for this breakdown as quarterly country info is not available.)
Business Segments
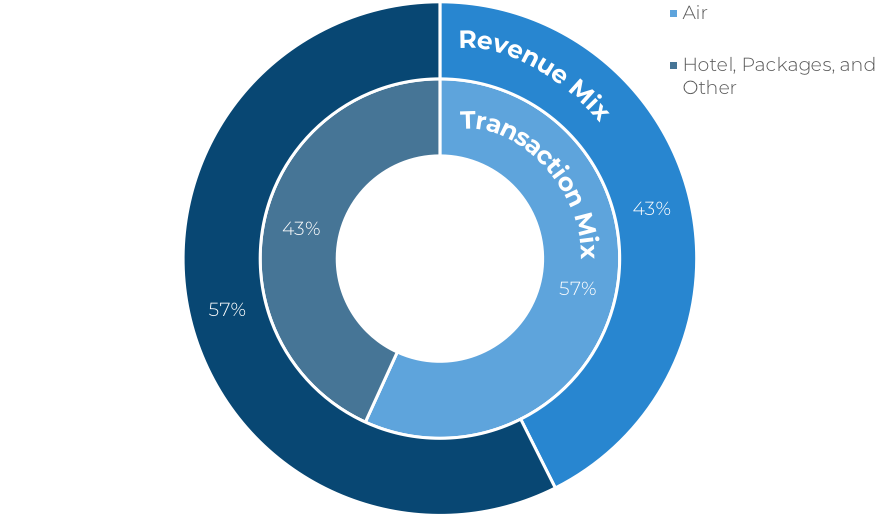
Despegar operates in two business segments — Air and Packages, Hotels, and Other Travel Products. Despegar was traditionally built off air tickets, and that segment still makes up the majority (57%) of its transactions over the last 12 months, but is now just 43% of revenue.
Source: Company filings, Skift Research. Data as of June 2018.
Air
Despegar’s historical underpinnings are in online air ticketing, and so, unsurprisingly, it dominates this segment in Latin America. Consider that the company sold approximately 17% of all airline tickets purchased through global distribution systems (GDSs) in the region during 2017, according to Amadeus, up from 15% in 2016.
Despegar, as an aggregator, benefits from a highly fragmented air market in Latin America — the top four air carriers in the region controlled just 38% of gross bookings in 2017, compared to a 63% top four share in the U.S., according to Euromonitor. As in many other geographies, low-cost carriers have played a major role in splintering this market.
The air platform is also of increasing importance to airlines based outside of Latin America, which generally have a limited local presence in the region. These international carriers now account for over 70% of the outbound flights booked on Despegar. These trips tend to be more profitable than domestic flights.
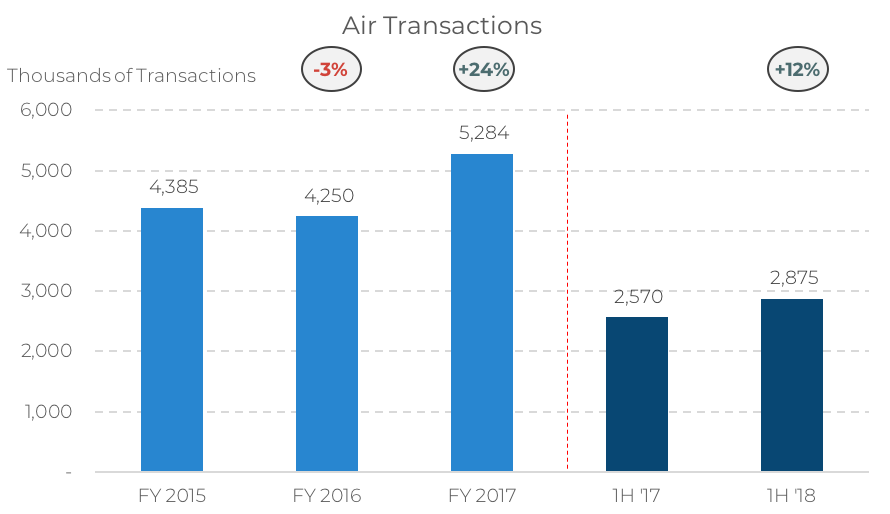
In absolute terms, this segment (including both GDS and all other channels) represents 5.6 million air transactions booked over the last 12 months (June 2017 to June 2018), which generated $239 million of revenue for Despegar. Air transaction volume grew 24% in 2017 after falling 3% in 2016. Air volume growth has decelerated in 2018 to date, but is still tracking nicely, up 12% in the first half of 2018 over the same period a year ago.
Source: Company filings, Skift Research. Data as of June 2018.
Packages, Hotels, and Other Travel Products
The packages, hotels and other travel products segment is of growing importance within the company. Though mostly hotels, this is a broad category that also includes vacation rentals, packaged deals, cruises, and in-destination activities, among others.
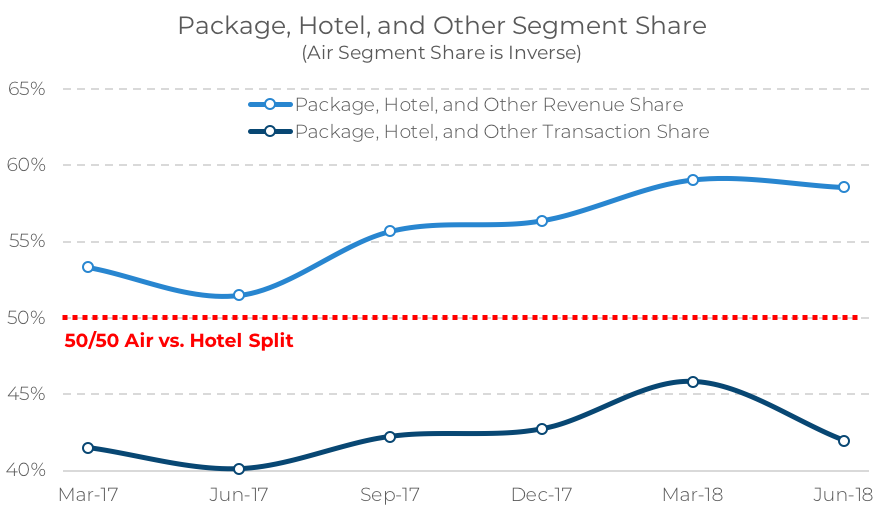
This line of business brokered 4.25 million transactions over the last 12 months, generating $322.2 million in revenue. As the below quarterly segment share chart shows, the package, hotel, and other segment made up 59% of revenue in Q2 2018. This represents both a near-term increase, a 7.1 percentage point gain in share over Q2 2017, and a long-term trend — the segment was just 48% of revenue in FY 2015.
Source: Company filings, Skift Research. Data as of June 2018.
Note: With just two reporting segments, air segment market share is simply the inverse of the above two lines.
This shift away from air ticketing is both long standing and intentional.
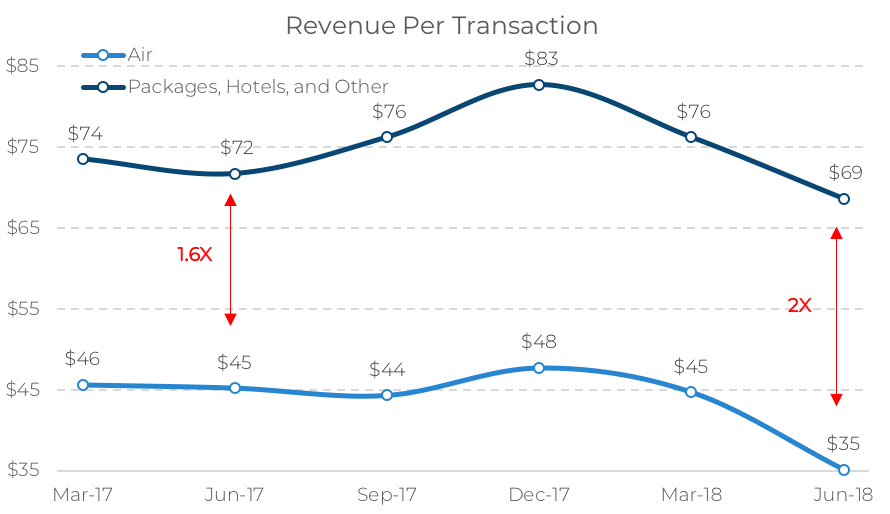
The reasons for this are twofold. Most importantly, hotels are a far more profitable product for Despegar than air tickets. Packages and hotels generated $69 of revenue per transaction to air’s $35 in the most recent quarter. Further, while absolute revenue per transaction has been under pressure, as the below chart demonstrates, the relative profitability of hotels to airlines has increased. For instance, in Q2 ‘18, hotels generated twice the revenue per transaction as air tickets, up from in Q2 ‘17 when hotels commanded a 1.6x premium.
Source: Company filings, Skift Research. Data as of June 2018.
The second reason for this segment’s prominence is quite simply that it includes more stuff. Despegar has followed the global trend in online booking sites toward becoming one-stop travel shops by adding vacation rentals, cruises, buses, in-destination activities, insurance, and others to its product offerings.
As management has broadened its product offering — increasing the platform’s value proposition and boosting both new customer visits and repeats — mathematically the segment with “other” in its name has grown as well.
There is substantial headroom for Despegar to grow in this highly competitive sector. According to Euromonitor, the top 10 hotel chains made up just 14% of gross bookings in Latin America in 2017, compared to 50% in the U.S. LatAm occupancy rates are also lower than in the U.S. — 59% versus 66%. Both of these trends amplify the need for booking platforms like Despegar in the marketplace.
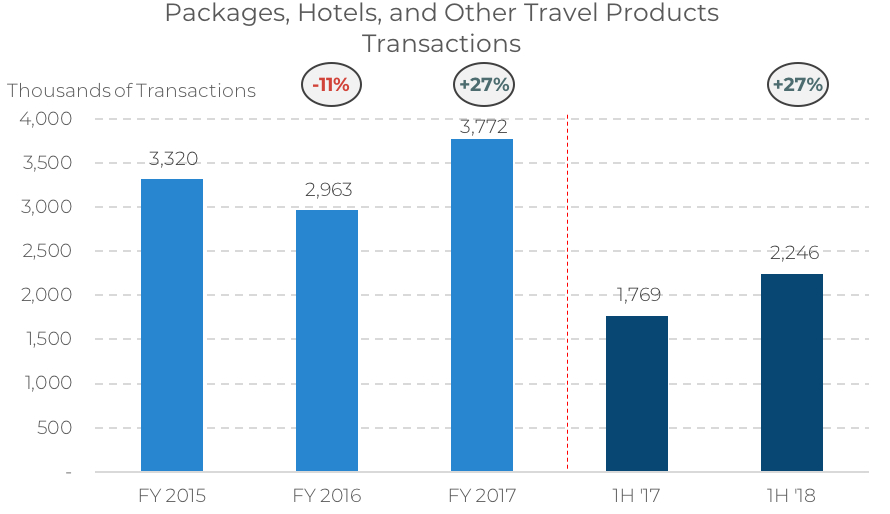
In-line with the broader economy, 2016 transactions of packages, hotels, and other travel products shrunk by 11% in 2016. However, this segment bounced back in 2017, up 27%, and, unlike air ticket transactions, has maintained this momentum so far this year, growing 27% in 1H ‘18 over 1H ’17.
Source: Company filings, Skift Research. Data as of June 2018.
Corporate Strategy
Global travel brands like Booking.com, Expedia, Trivago, and Airbnb all compete with Despegar in multiple markets across Latin America. Other rivals include CVC, an offline travel agency with over 1,000 retail locations across Brazil and 6,500 independent agents. CVC is no slouch — it booked $1.5 billion USD of travel in Brazil in the first-half of 2018, according to its public filings, and has a small, but expanding, online presence. Local, country-specific online travel agencies also compete, such as BestDay.com in Mexico or Almundo.com in Argentina and other LatAm markets.
In the face of these challenges, Despegar has performed admirably thus far into its life. The company had 4.6 million unique customers shop its site in 2017, up from 4.0 million in 2016 and 2.7 million in 2012. The site boasts 10 million user-generated reviews, of which nearly one-fifth were posted in the last year alone.
64% of Despegar customer had previously purchased from the site in 2017, up four percentage points from a 60% repeat rate in 2016. Lastly, 52% of web traffic was direct to the site rather than through paid channels.
These trends are all indicative of the virtuous cycle of growing user brand recognition and engagement that is so crucial to any online aggregation platform. To maintain this momentum, Despegar recently announced plans to launch a loyalty program in 2019 and has signed co-brand credit card agreements with Visa and Mastercard.
But those plans are for the future; in the past and on an ongoing basis, Despegar has been aided by marketing campaigns, tech investment, a wide product offering, and other approaches. Among the most important of its corporate strategies has been its partnership with Expedia and several region-specific initiatives that we detail below.
Expedia Partnership
On March 6, 2015, Despegar inked a transformative deal with Expedia.
Despegar entered into an outsourcing agreement with Expedia whereby the Latin American company could offer Expedia’s global inventory to its customers (“The Expedia Outsourcing Agreement”). Concurrent with the outsourcing agreement, Expedia invested $270 million in Despegar and is a 14% owner of the company today.
All of the hotel and other lodging supply that Despegar offers outside of Latin America is exclusively provided to its platform via Expedia. Even within Latin America, Expedia is now Despegar’s preferred provider of hotel and other lodging reservations. Expedia also received the right to market Despegar’s supply to its clients. More recently, in August 2016, Despegar deepened this relationship with an expanded agreement to offer its own inventory on Expedia affiliates (“The Despegar Outsourcing Agreement”).
Under the Expedia Outsourcing Agreement, Despegar receives a “marketing fee” for each Expedia-powered booking it makes, effectively earning a share of Expedia’s commission for driving the booking through its own platform. The reverse holds true for Expedia bookings made through Despegar’s platform.
The deal comes with risks. Despegar has surrendered some of its strategic flexibility, especially outside of Latin America, and is making a big bet on the quality and quantity of the hotel supply that Expedia can offer.
But, in our view, the strengths of the deal far outweigh the risks. The agreement has been quite profitable with Expedia’s supply representing 9.1% of Despegar’s gross bookings in 2017. The marketing fee earnings on those transactions, net of fees paid to Expedia, generated revenue of $37 million in 2017, 7% of company-wide sales, and $27 million in 2016.
Further, in one fell swoop this deal effectively gave Despegar broad international reach and an order of magnitude increase in its hotel supply. We estimate that Despegar has direct supplier contracts with approximately 25,000 hotels, implying that the Expedia partnership is responsible for 425k property listings (As a quick check, this ties decently well with Expedia’s reported 555k global hotel listings).
This powerful co-marketing agreement automatically renews every year with several exceptions. Prior to 2022, terminating the deal requires the mutual consent of both Expedia and Despegar. Afterwards, Despegar may unilaterally cancel the agreement, but only will if it buys back Expedia’s ownership stake in itself at fair market value. In either event, Despegar will also be required to pay a $125 million termination fee, giving it a strong incentive to renew. The only way Despegar can avoid the multi-million dollar fee is if Expedia, after 2022, chooses to terminate the deal.
An all-out Expedia acquisition of Despegar has been rumored ever since this deal was signed. It may make sense on paper, but investors should take note that Expedia’s investments in Despegar are subject to a “standstill” agreement until September 2020. Recall that Expedia owns 14% of the company; under this agreement, Expedia cannot increase its ownership stake above 35% without making an offer for at least 75% or more of the company. The standstill effectively forces Expedia into an all-or-nothing proposition. It cannot significantly increase its ownership stake in Despegar without committing to purchasing the nearly the entire thing. While not insurmountable, this standstill is a speed bump to a slowly phased acquisition of Despegar by Expedia.
Region-Specific Initiatives
As a Latin American travel specialist, Despegar has built a toolkit to fit to the contours of its local market in unique ways. This includes strategies adapted for the credit constraints of its customers and the growing importance of mobile to the Latin American market.
Offering Customers Credit Terms Has Been a Major Driver of Sales
One of Despegar’s regional adaptations, and the one we are most impressed with, is its commitment to help customers book travel, regardless of their creditworthiness.
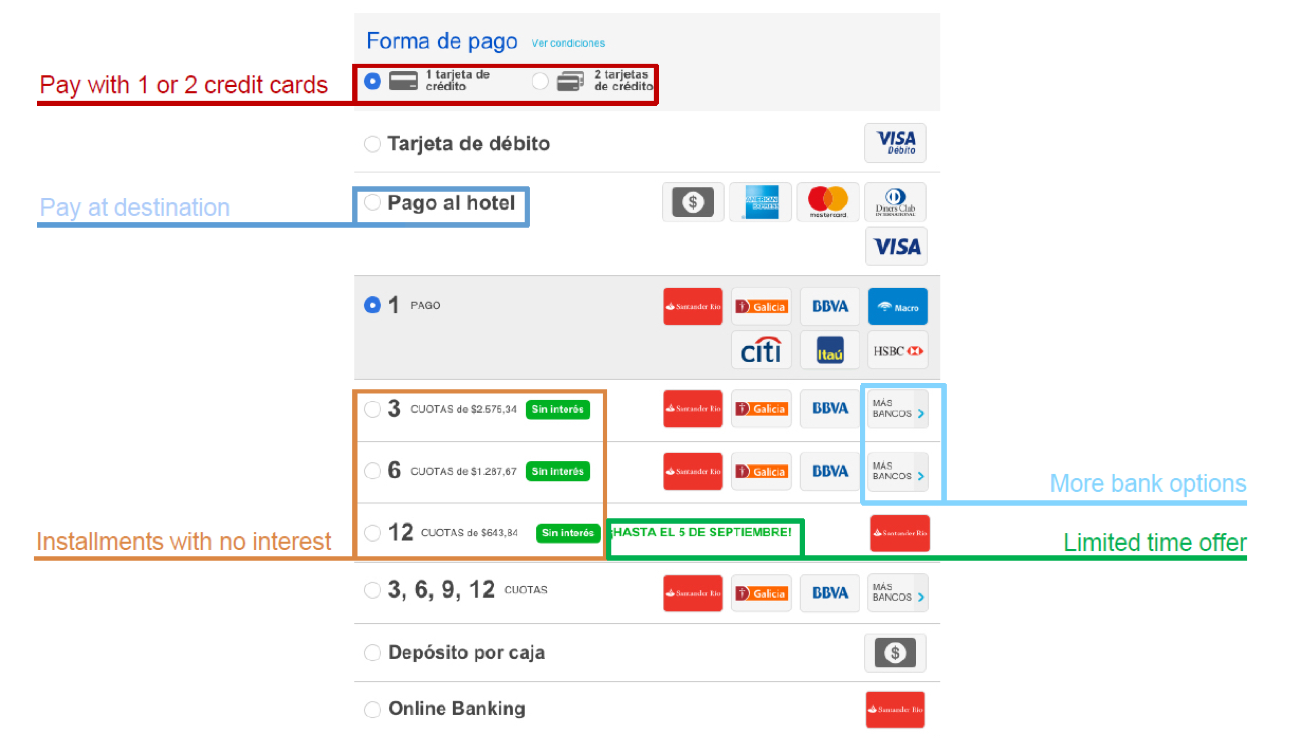
Despegar has partnerships with a wide range of local banking partners to offer installment plans to pay for travel. Many of these installment plans are low-interest or even interest-free to the customer and allow them to make larger purchases than they might have otherwise been able to.
Local partner banks are the ones that actually extend credit to consumers and as a result own the collection risk. In exchange for making these loans, Despegar pays the banks directly to compensate for the logistics and for credit-risk they are taking. It may also subsidize the interest rate to offer a lower cost to the end consumer. Despegar does not directly bear the credit-risk of these customers. Instead, Despegar is effectively paying some of its product margin to local banks, in exchange for facilitating a greater volume of transactions than would otherwise be available.
In most cases, these payments plans are a boost to Despegar’s cash flow as the local bank will pay for the full transaction upfront, at the time of booking, giving Despegar several months of working capital to use before it is due to the supplier at the traveler’s time of check in.
The exception is in Brazil, where local banks will pay Despegar through monthly payments, though Despegar still does not take on the consumer credit risk in either case. Despegar may at times choose to factor these Brazilian payments, e.g. sell the cash flows off to a third-party in exchange for a lump sum, to generate extra cash or to reduce foreign exchange liabilities.
This initiative is not just a behind-the-scenes, finance operation. The mentality extends all the way to the user experience on the front end.
Source: Company investor presentation. Data as of June 2018.
For instance, consider the booking flow above. It prompts the buyer with installment plans of various lengths from multiple banks. Of note, it also allows for the buyer to easily split the payment across multiple credit cards in a single transaction, allowing customers with lower credit limits to make larger purchases.
Despegar is not the sole promoter of this payment method and in fact, Installments are quite popular across Latin America. Martin Schrimpff, Co-Founder of PayU, a financial services company, estimates that installments may account for as much as 60% of ecommerce activity in the region.
Despegar sees a similarly high usage rate with 55% of its transactions in both 2017 and 2016 completed using an installment plan. It is clearly a crucial payment method for this business and its customers.
To us at Skift Research, these payment and design features lay bare an implicit assumption that a U.S. executive might carry: that the typical consumer has sufficient credit to book travel. That is not a given in Latin America, and makes installments, in our view, an excellent example of the challenges and quirks that come with a localized travel offering.
Installments do not come without risk. For instance, though Despegar does not bear default-risk directly, in an economic downturn, banks will constrain their credit issuance, which will likely pinch Despegar with its reliance on installments more than it would have otherwise.
Nonetheless, the good seems to outweigh the bad as installments help boost purchase volumes with fairly limited risk. Executives should make note of these regional innovations, even if they do not plan to expand to Latin America as the installment idea is even starting to be trialed and adopted in developed markets, enabled by fintech startups such as Affirm.
Mobile Reach is Spreading Within Latin America
As is the case in many other global regions, mobile phone use is on the rise in Latin America and is rapidly transforming the local business landscape. The GSM association, a mobile network operator trade group, estimates that Latin America will add 110 million new unique mobile subscribers by 2020, bringing the total number to 524 million. The Latin American population is projected to reach over 666 million by then, according to the United Nations, implying a penetration rate of 78%.
Despegar has been investing heavily to stay in front of this growing trend. According to the company’s internal data, its mobile app has been cumulatively downloaded 41 million times, making it the most downloaded travel booking app in the region. In 2017 and 2016, mobile accounted for approximately 54% and 50%, respectively, of all Despegar user visits.
Conversion of browsers to buyers on mobile remains difficult, though strides are being made. In 2016, 23% of Despegar’s transactions came from mobile, improving by 500 basis points (bps; 1 basis point = .01%) to 28% in 2017. Encouragingly, the mobile transaction rate continues to improve, gaining 460 bps of share year-on-year to represent 33% of all transactions in Q2 2018.
Despegar’s phone app can be quite advanced, for instance, offering personalized discounts based on stored customer behavior. It is also available in both Spanish and Portuguese. Developing localized, high performance mobile apps is not easy from either a talent or cost perspective, however.
Despegar spent $76.2 million on technology and product development over the last 12 months, a budget that few small, regional competitors could match. We believe that the rise of mobile shopping provides a further advantage to current incumbents and, while not all of the above budget went towards app development, it nonetheless demonstrates our point that competitors will need increasingly deep pockets just to pay for table stakes.
Financials
The Argentine Peso and Ongoing Economic Situation Pose Challenges
Since we began writing this report the Argentine peso has come under significant pressure, depreciating 50% against the U.S. dollar year-to-date (as of 9/11/2018).
The Argentinean economy, already shaky was further hurt by a drought that reduced agricultural yields. The economic situation has been compounded by this currency weakness. The IMF has downgraded economic growth forecasts for Argentina and now expects GDP to contract in the second and third quarter of this year. It sees overall GDP growth of 0.8% in 2018 and a gradual recovery in 2019 and 2020.
Private sector economists have been less kind, with, for example, Alberto Ramos, head of Latin American economics at Goldman Sachs, downgrading his outlook for the Argentine economy. He now expects GDP to contract more than 2% this year and for inflation to top 40%.
This will no doubt hurt Despegar’s results. A weaker Argentine peso will have a direct impact on financial results which must be translated back into dollars for reporting purposes at current rates. To an extent this can be offset by using local suppliers which are also priced in pesos, but this will not fully insulate Despegar’s income statement.
Despegar management on its Q2 earnings call estimated that the peso weakness to that point had reduced gross bookings growth by five percentage points in the quarter. In other words, 12% gross bookings growth would have been 18% growth in the absence of the currency devaluation. This is helpful, but we note that sadly the peso had fallen a further 20% against the dollar since these statements were made in mid-August. That means the currency drag on Despegar will surely worsen in quarters to come.
The peso devaluation has a secondary knock-on effect on demand. Economic weakness by itself makes Argentines more likely to save than the spend on travel. Plus LatAm’s heavy reliance on installment plans makes the whole region more susceptible to the impacts of a contraction in consumer credit. It also makes international travel more expensive in proportion to the amount that the currency fell by. This causes consumers, to the extent that they still travel, to shift towards domestic trips which, tend to have lower selling prices and margins even under good conditions. Management noted that in Q2, its International order mix declined by 95 basis points year-on-year. Again, we expect that shift to continue through the rest of the year.
Both Despegar and Argentina are no stranger to currency weakness. If there is a silver lining, it is perhaps that this economic downturn will flush out weaker hands, allowing Despegar to gain share and leaving the company in a better position to compete when the economy recovers. We note that the company has no major outstanding debt, positive free cash flow over the last twelve months, and $400 million in cash and other short-term equivalents on its balance sheet.
It is often liquidity or credit considerations that kill businesses in acute economic crises. From this perspective, Despegar seems fairly well-positioned to weather a short-term downturn. That said, we still expect financial results will suffer in the coming quarters.
Top-line Trends
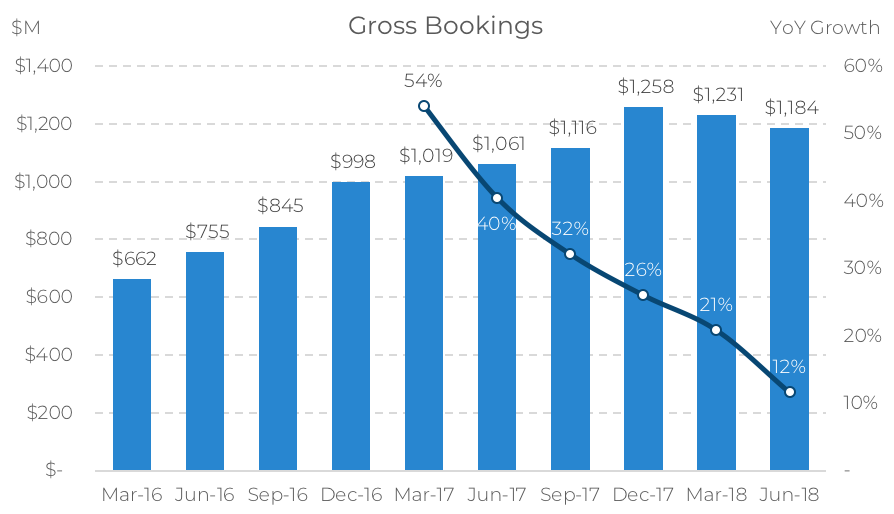
Despegar continues to grow the absolute level of bookings it commands, but we note a troubling trend of decelerating growth. Examining bookings on a quarterly basis, the below exhibit shows that the year-on-year growth has been steadily decelerating for the past 15 months. We do not think that this is simply a result of the law of large numbers given how much headroom Despegar, theoretically, has left to grow into. Some portion of these deceleration is likely the result of a slower economic environment and year-to-date currency weakness.
Source: Company filings, Skift Research. Data as of June 2018.
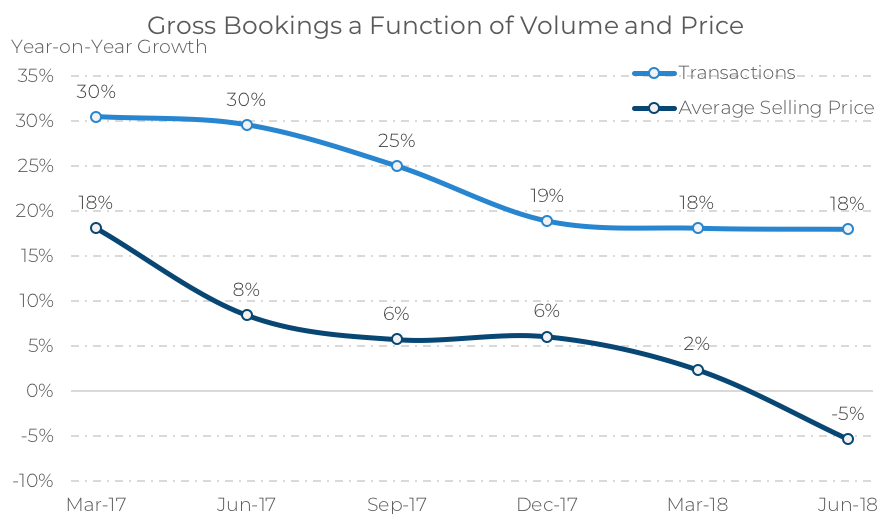
We can examine the underlying trends by decomposing gross bookings into its two components: volume, measured by transactions in the quarter; and price, measured by average selling price in the quarter.
We compare the two below and find that much of the recent deceleration in Despegar gross bookings was due to changes in the average selling price of travel products on the platform. Average selling price can be a much more volatile data series because it is impacted by changes in foreign exchange and the mix of products sold. In other words, when the economy weakens travelers are more likely to switch from higher-priced international travel to lower-priced domestic trips. This is compounded by the mathematical impact of currency depreciation on average selling prices, which are booked in local regional currencies, but reported in U.S. dollars.
Source: Company filings, Skift Research. Data as of June 2018.
Because ASPs can fluctuate so much we look to transaction volumes as a double-check on underlying performance. If transactions are steady, it means that customers are still travelling at the same pace, but perhaps they are taking cheaper tricks or the exchange rate is having a large impact.
We take comfort in the fact that transaction volumes have been stable for the last three quarters at an approximately 18% growth rate. While the deceleration of this rate from 30% in 2017 still raises our eyebrows, we note that 2016 was a weak year for Latin American economically, providing a low base number that propped up year-on-year growth rates in early-2017.
We still do not like the recent gross bookings deceleration, but are concerns are eased somewhat by transaction growth rates that continue to show stability. We would be far more concerned with the trend in gross bookings were transactions and selling prices to fall in tandem. Average selling prices are likely to recover, when LatAm currencies and economies recover.
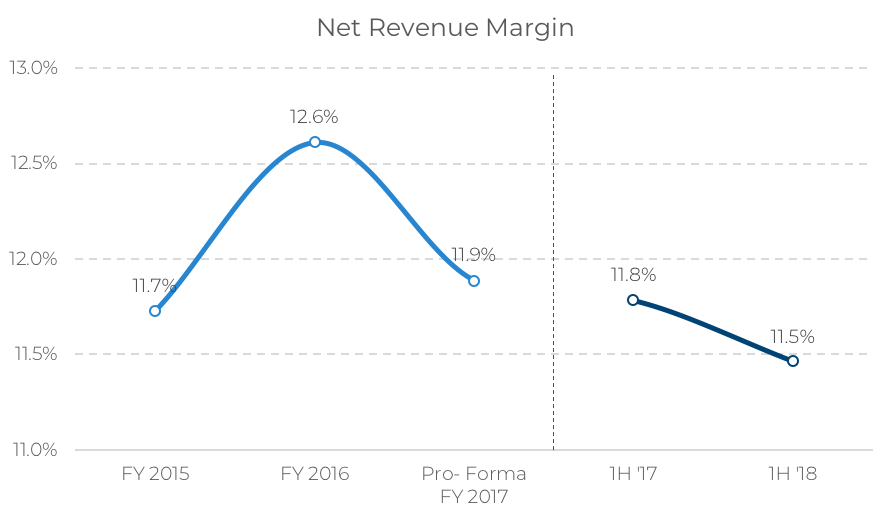
Turning now to the take rate, we find that Despegar earns a healthy commission on the products it offers. There have been minute changes in the net revenue margin that the company earns, admittedly downward, but all within a 110 bps range.
As we noted with above, a take rate in the 11–12% range is quite healthy and in-line with commissions earned by peers such as Expedia and MakeMyTrip. Despegar, MakeMyTrip, and Expedia, all have a heavy emphasis on air tickets so it makes sense to us that take rates are similar. Booking Holdings, which has always had a much larger focus on hotels earns a prized 15% take rate. Though not close to Booking Holdings at this time, Despegar could see its net revenue margin trend higher as it continues to shift towards hotels.
Source: Source: Company filings, Skift Research. Data as of June 2018. Pro-forma adjusts 2017 numbers for a recent revenue recognition shift.
Profitability and Margin Analysis
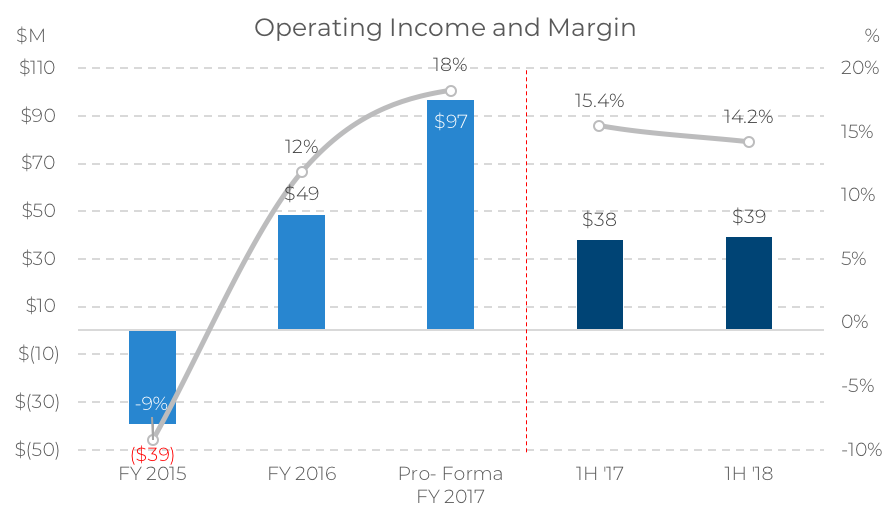
After running a loss in 2015, Despegar ended 2016 in the black and has had a healthy operating margin since. Operating income for 2018 is trending slightly ahead of the 2017 pace. Operating margins have declined 126 bps to date over the prior period but remain roughly in the same ballpark and ahead of FY 2016. The fourth quarter of the year has the largest impact on operating income from both an absolute dollar and margin perspective, meaning full-year results could still differ materially from how they are shaping up so far.
Source: Source: Company filings, Skift Research. Data as of June 2018. Pro-forma adjusts 2017 numbers for a recent revenue recognition shift.
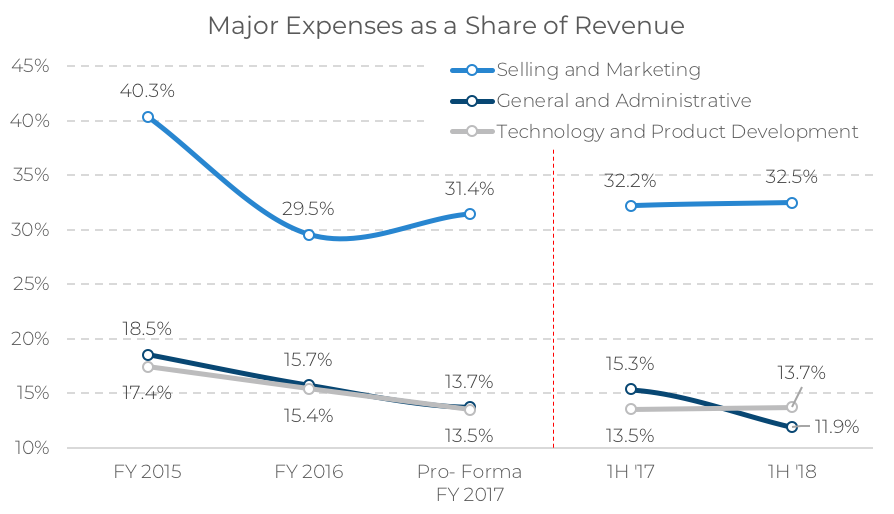
Selling and marketing is the most important part of Despegar’s expense budget, as is the case at all other major online travel agencies. It fell dramatically as a share of revenue in 2016, but has since stabilized and even ticked up slightly in 2017 and the start of this year.
Both the “general and administrative” and the “technology and product development” line items have shown nice operating leverage since 2015 as Despegar achieves economies of scale. In the first half of this year, technology expenses exceeded general and administrative costs for the first time, likely a reflection of the investments in mobile and other development initiatives we discussed above. Selling and marketing expenses increased by 30 bps as a share of revenue in 1H ’18 versus 1H ’17.
Source: Source: Company filings, Skift Research. Data as of June 2018. Pro-forma adjusts 2017 numbers for a recent revenue recognition shift.
The vast majority of Despegar’s selling and marketing budget was directed toward a mix of online and offline advertising, $145 million out of $166 million in 2017. This is more in-line with what we see at Booking Holdings and Expedia, which spend the majority of their S&M expense on advertising, and contrasts with MakeMyTrip which prefers discounts.
In the first half of this year, selling and marketing increased as a share of revenue by 30 bps compared to the same time frame in 2017. However, all of the year-to-date increase in selling and marketing came in the first quarter of the year.
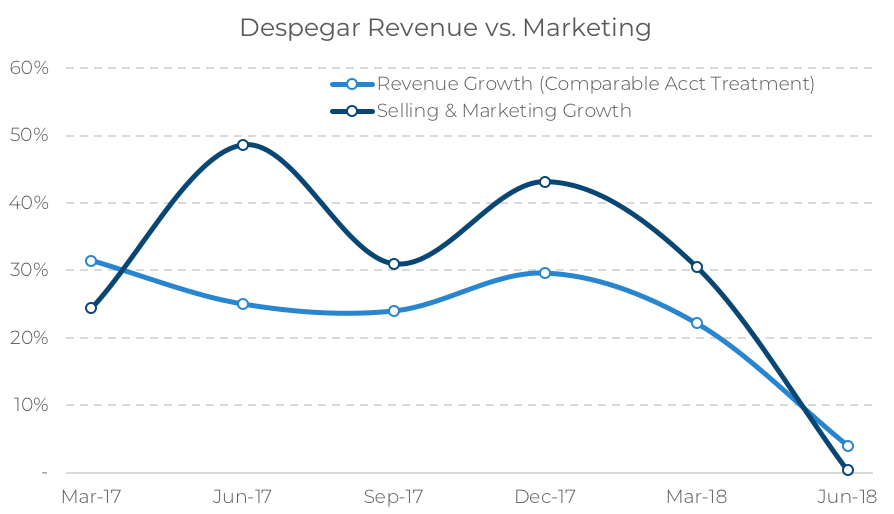
Dialing down to the quarterly level, we can actually see that in the most recent period, Q2 ‘18, revenue grew faster than selling and marketing expenses did, creating operating leverage. In fact, in Q2 ‘18, sales and marketing did not grow at all year-on-year. That stands in sharp contrast to the prior trend which saw selling and marketing growing year-on-year and at a faster rate than overall revenue.
This positive development was part of a worldwide phenomenon that saw marketing expenses fall as a share of revenue at nearly every online travel site. We will be watching closely to see how this global trend progresses next.
Source: Company filings, Skift Research. Data as of June 2018.
Conclusion
At first glance, it seems like an inauspicious time to be talking about emerging markets. Widespread currency weakness has put economists and Wall Street analysts who follow the region on high alert. Since we began writing and researching this report, the IMF revised down its growth outlook in Argentina, Brazil, and India. We have been mostly positive on the companies and travel markets in these regions, but do not mean to imply that progress will strictly be a smooth, upward path. In fact, near-term turbulence seems likely.
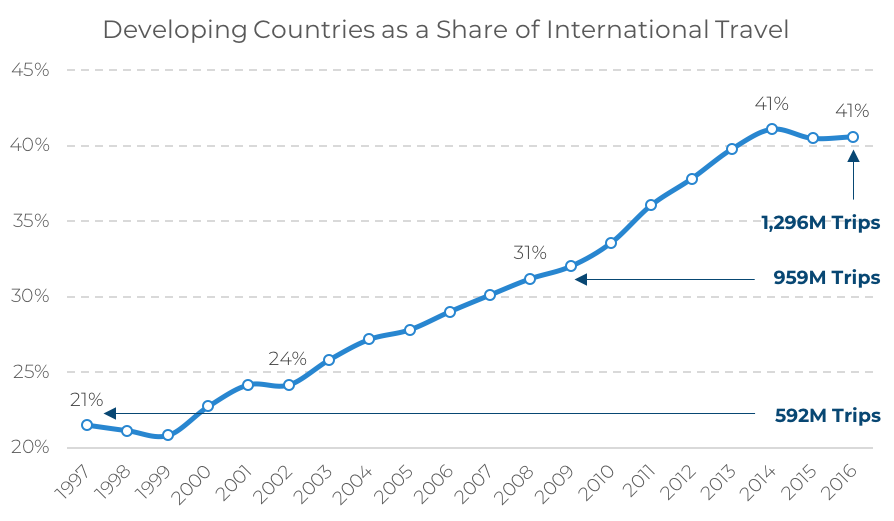
However, we encourage executives and investors alike to focus on the long-term trend in these countries. Overall, the emerging market consumer is growing in both number and purchasing power. According to the World Bank, travelers from mid- and low-income countries made 1.3 billion trips in 2016, 41% of the global total. That is up from a 21% global share 20 years ago. As these travelers continue to expand their horizons, they will determine the future course for our industry; it is crucial that executives understand these markets.
Source: The World Bank, Skift Research. Data as of 2016.
Skift Research’s intention was for these deep dives into MakeMyTrip and Despegar to help provide some clarity into two crucial developing travel markets, India and Latin America.
On the one hand, there are similarities that both of these business share with global online travel agencies like Expedia and Booking. Unsurprising, since at their core all operate with the same business model. Both MakeMyTrip and Despegar rely on achieving local scale in two key areas: advertising and supply.
Perhaps more interesting is how each business localizes its offering to match its country of operations. It can be a common practice to lump all emerging markets together into one bloc. We hope that our case studies demonstrate the flaws with this practice. Though there are high-level commonalities across emerging markets each region requires a custom approach.
This is a challenge for businesses but can be a competitive moat when done correctly. For instance, MakeMyTrip launching its app in multiple regional dialects did not come cheap, but should pay dividends through increased customer contact and trust that competitors will be hard pressed to match.
Partnership is another valuable strategy for these businesses. Here Despegar’s partnership with Expedia strikes us as a worthwhile template. It allows the company to add substantial overseas inventory while remaining focused on executing in its home market, which is still plenty competitive.
We are still in the early-innings of the online travel game for emerging markets. India and Latin America are two promising regions, that boast strong local champions. We expect further change, much of which will have ripple effects globally, and will continue to follow developments at MakeMyTrip and Despegar closely.
Further Reading
- Skift Research, “The State of Online Travel Agencies 2018 Part I: Advertising.” June 2018
- Skift Research, “The State of Online Travel Agencies 2018 Part II: Supply.” August 2018
- Skift Research, “The State of India Outbound Travel 2018.” August 2018
- CAPA India, “CAPA-Expedia India Outbound Travel Research.” 2018
- Skift, “Despegar Tripped Up by the Ailing Economies of Argentina and Brazil.” August 2018
- IMF Blog, “Outlook for the Americas: A Tougher Recovery.” July 2018
- Expedia Group, “Latin America Travel Trends.” 2018
- Skift, “This Is a Pivotal Moment for Booking Site Marketing Strategies.” August 2018
- Skift Research, “A Deep Dive Into Ctrip and the China Online Travel Market 2017.” July 2017

