Report Overview
Digitalization is not a hype and is here to stay. For travel marketers who want to reach their target audience, this means continued shift to digital channels for marketing campaigns, if they haven’t already done so. What’s more, consumer data enabled and enriched by digital channels and technologies makes it possible to connect online and offline consumer activities, map the whole consumer journey and increase marketing performance of offline campaigns. Yet, questions still remain on what’s the perfect marketing and media mix and what can be done to optimize marketing performance. To help address these questions, Skfit Research conducted a survey of marketing professionals across various travel sectors. This report presents major findings from the survey and analyzes relevant trends that lead to better campaign executions. Chief Marketing Officers (CMOs) and other decision makers responsible for marketing strategies to drive growth or specific marketing tactics can use this report to see how your company stacks up against peers, identify gaps, and optimize for better results.What You'll Learn From This Report
- How travel companies allocate marketing budget between paid media, marketing technology, and third-party services and what’s the shift for 2019
- What is a typical media mix among travel marketers and how does that compare with other industries
- How much travel companies spend on each digital format such as search and social and what’s expected to change in 2019
- Marketers’ ratings of ad effectiveness in delivering ROIs for major media channels and formats and strategies to optimize performance
- How travel companies structure their digital advertising teams and its impact on multichannel and attribution marketing adoption
- Advertising allocation based on customer journey
- Top marketing priorities and challenges for 2019
- Highlights of marketing and advertising budget variations across different travel sectors and company sizes
- Skift’s recommendations on strategic and tactical focuses to optimize ad performance and drive growth
Executive Summary
Digitalization is here to stay and impact individuals and businesses in some fundamental ways. Travel leads many other consumer sectors in digital and mobile adoption. Close to 50% of travel bookings in the U.S. already happen in digital and mobile channels, much higher than that for the retail sector (e-commerce accounts for only about 10% of total retail sales in the U.S.). As consumers continue to turn to digital, and increasingly, mobile channels, for inspirations on the next vacation spot and travel bookings, travel companies’ reliance on digital and mobile platforms to reach these consumers continues to deepen.
Along with the heavy investment in digital, the quality of digital advertising continues to improve with more advanced targeting and measurement capabilities. What’s more, consumer data enabled and enriched by digital channels and technologies makes it possible to connect online and offline consumer activities, map the whole consumer journey, and increase marketing performance of offline campaigns.
Yet, controversies over ad fraud, ad viewability, ad blocking, and data breaches in the past few years have cast some doubt on whether digital is a viable advertising channel. And the duopoly of Google and Facebook serves as both a big opportunity for advertisers, with their massive scale and reach, and as a huge obstacle for them to stand out from the crowd.
To help address the questions of what’s the perfect marketing and media mix and what to do to optimize performance, Skift Research conducted a survey asking travel marketing professionals how much they spend on major advertising channels and formats, how effective each channel and format is, and their priorities and goals for 2019. This report draws from the key findings of the survey and provides relevant trends that marketing executives need to keep abreast of to deliver better marketing results and drive revenue growth.
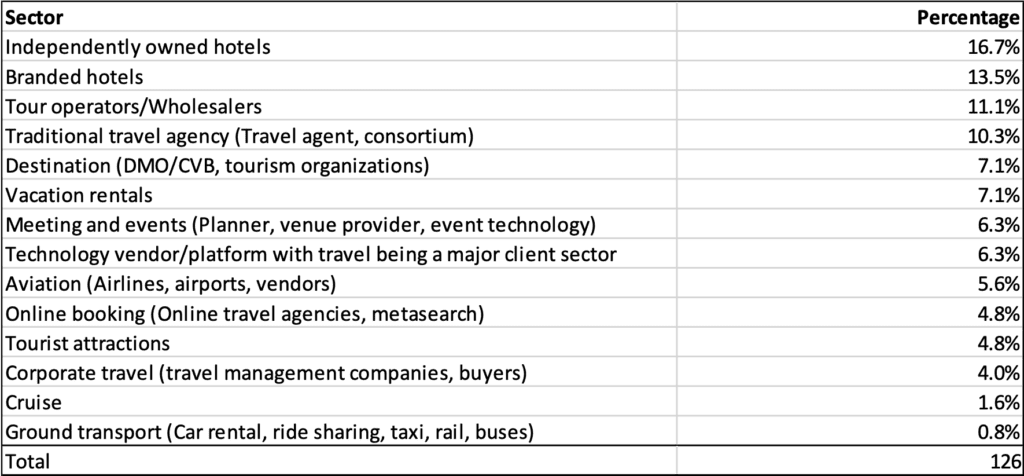
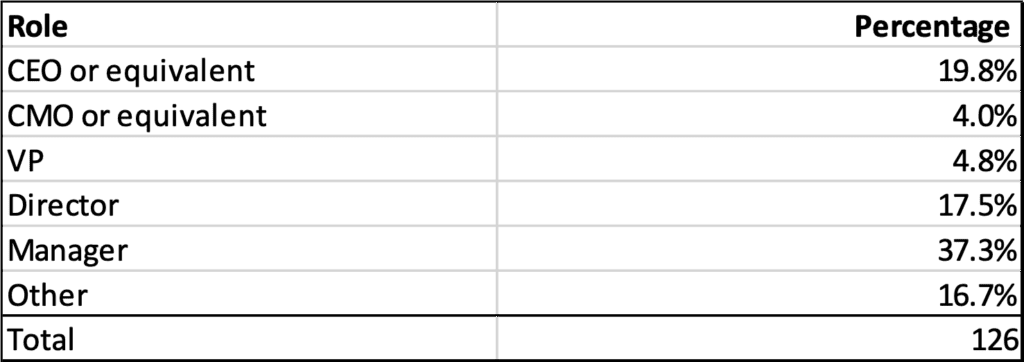
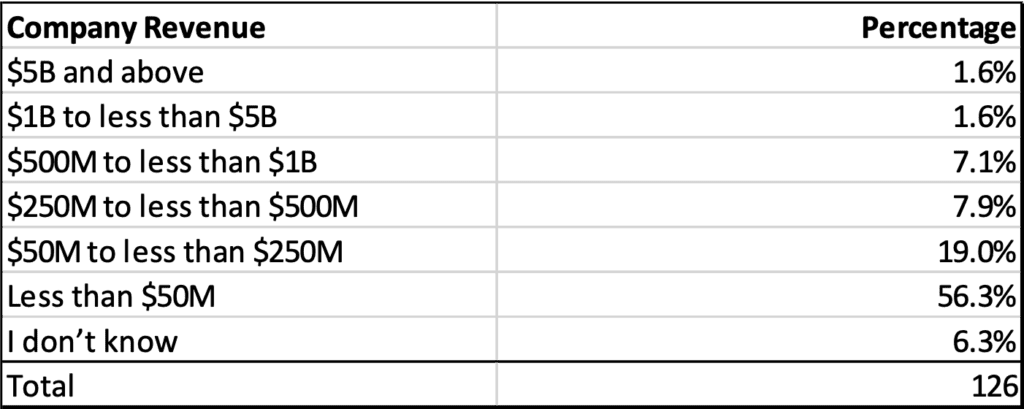
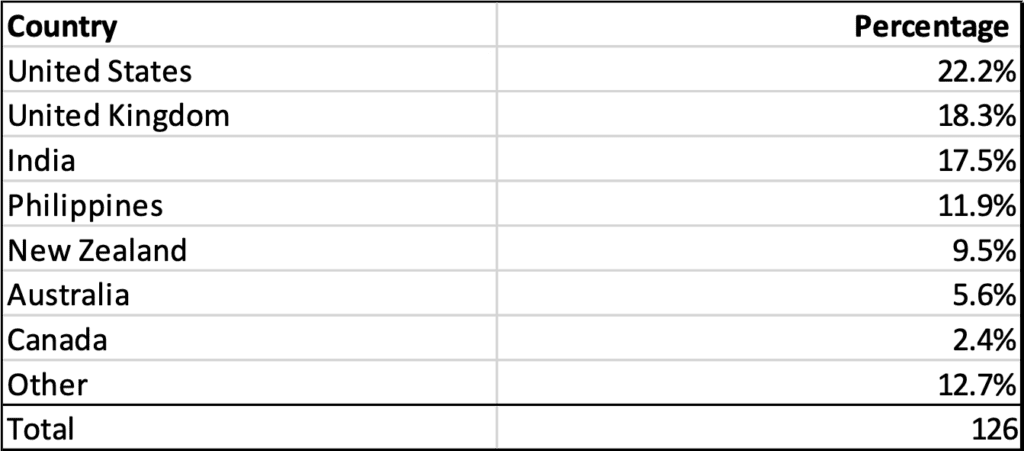
The demographic details of the survey respondents are presented in the appendix of the report.
Travel marketers spend half of marketing budget on advertising and plan to increase ad spending in 2019
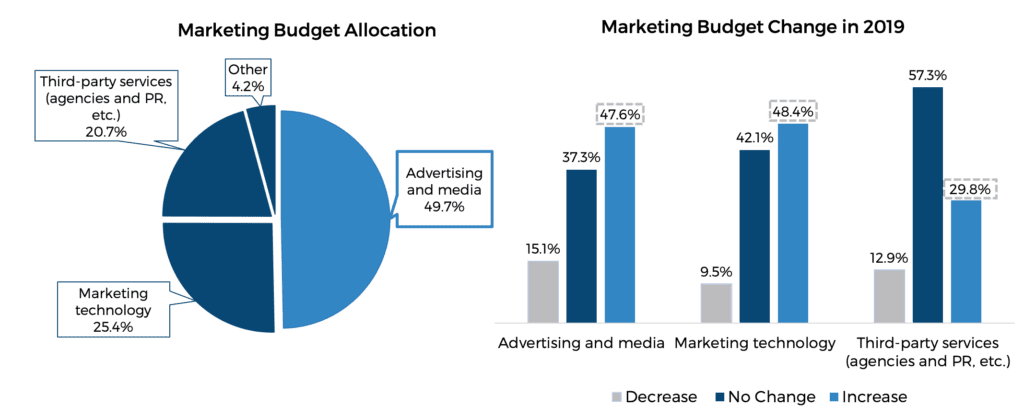
Despite the rising popularity of and a myriad of services dedicated to earned and owned media, paid media is still the bread and butter of travel companies’ marketing strategies. Discounting personnel costs, advertising accounts for half of all marketing budget for the travel companies surveyed. For 2019, 48% of marketers surveyed plan to increase their ad budgets.
Marketing technology accounts for 25% of total marketing budgets, four percentage points higher than what travel marketers spend with agencies, PR, and other third-party services. This is a clear indication of the crucial role that marketing technology (martech) is increasingly playing in marketing operations and campaigns. Data and analytics capabilities, marketing automation, and infrastructure building will continue to shape how modern marketing teams and campaigns are operated and measured. For 2019, 48% of marketers surveyed plan to increase their budgets for martech, the highest of all three categories.
Even though it makes up the smallest share, third-party services still account for 21% of total marketing budget for all the travel companies surveyed, which translates to some significant spending figures. While traditionally, agencies were must-haves for large-scale companies’ branding and advertising efforts, there has been some shift to building in-house capabilities in recent years. The rise of technological capabilities around data and measurement and the proliferation of vendors in the space play a big role in this shift. While there is no one-size-fits-all approach to whether to rely on outside services or build in-house teams, achieving a good balance requires deliberate assessment of goals, costs, and needs.
What’s worth noting is that while 48% of marketers indicate they plan to increase budget on advertising in 2019, 15% say they will decrease spending on advertising, compared to only 9% who say they will decrease spending on marketing technology and 13% who claim they will decrease spending on third-party services. This is likely a response to ad waste, indicating some smart marketers are already taking actions to reduce ad waste and increase efficiency. We will further discuss tactics for increasing ad efficiency below.
Digital accounts for 59% of total media advertising budget in 2018 and will continue to grow in 2019
Thanks to a handful of innovative pioneers in travel during the early internet years and the rise of the online travel agencies (OTAs), travel is one of the earliest and the most advanced sectors in e-commerce adoption. With close to 50% of bookings occurring online, it doesn’t require much to convince travel marketers to have a strong digital advertising strategy.
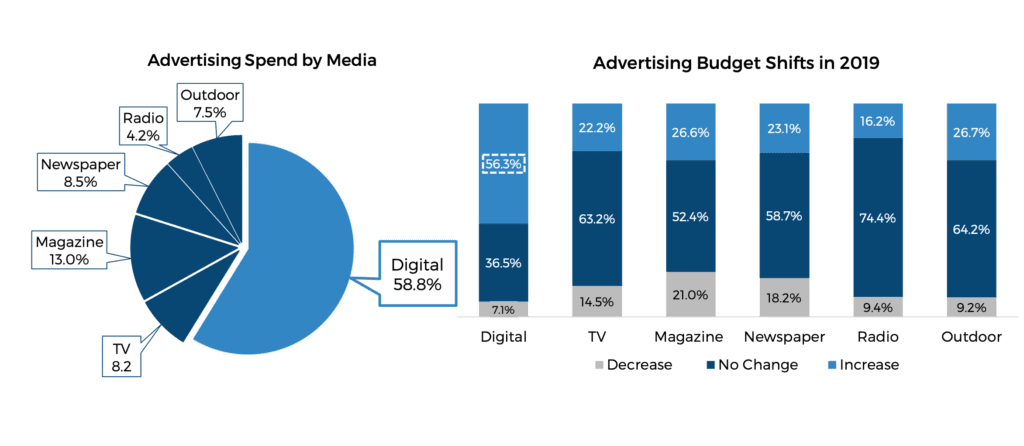
On average, travel companies in our survey spend 59%, a lion’s share of their total media budget, on digital advertising. We believe this number is fairly representative of the whole travel sector. According to eMarketer, digital accounts for 48% of total media advertising across all sectors in 2018. Travel is clearly ahead of the curve in digital adoption. As mentioned above, the prevalence of online travel transactions is a key contributor to this digital focus. As more and more traditionally offline travel sectors continue to shift to digital, such as tours and activities, marketers will continue to turn to digital channels to drive sales. This trend is demonstrated by our survey result. Fifty-six percent of respondents plan to increase budget spent on digital in 2019, more than twice those who plan to increase budget for any non-digital media outlets.
Source: Skift Research
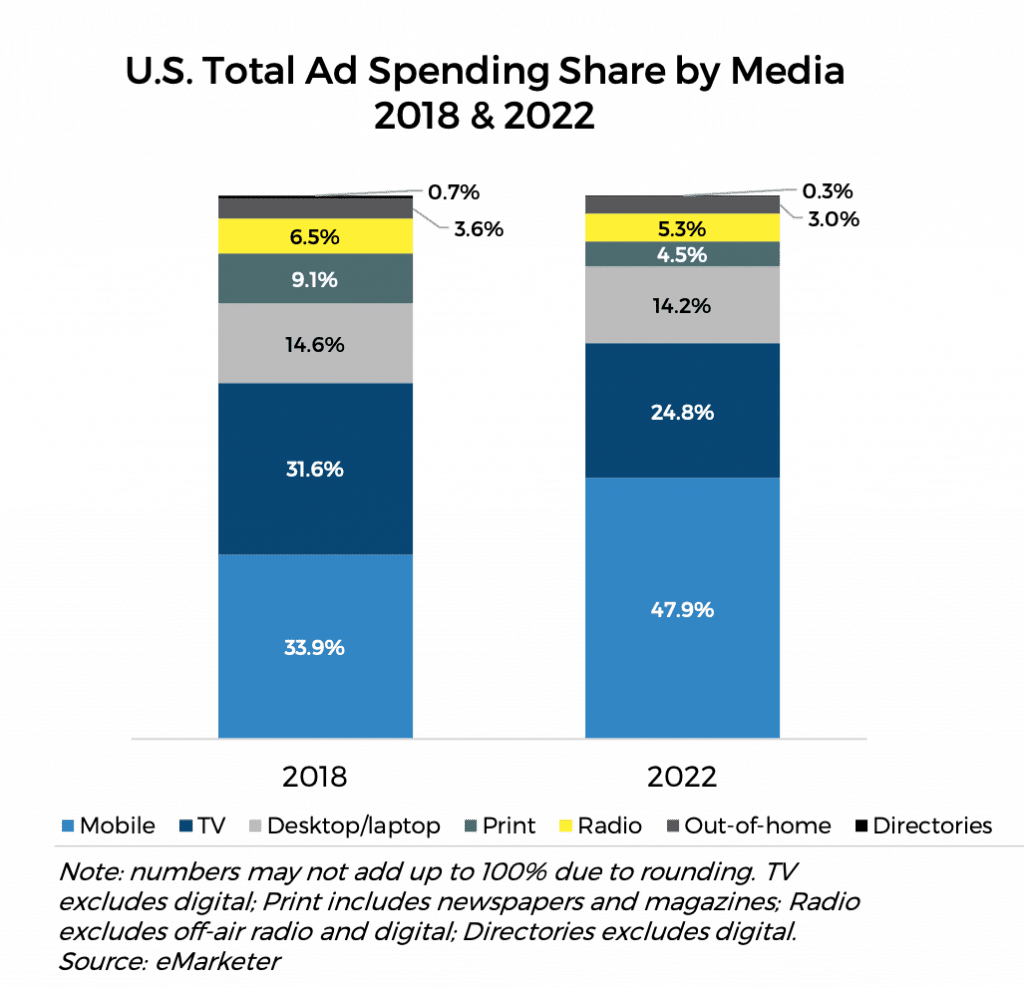
By contrast, these travel companies only spend 8% of their ad budget on TV, the most prominent traditional media outlet. This is significantly lower than the average ad spend on TV across all industries. According to eMarketer, digital only surpassed TV as the highest spending ad channel in 2017, with TV accounting for 32% of total media ad spending. So why does travel sector spend so little on TV? There are a few elements to answer this question. First, is this number representative across all travel sectors? Second, what’s unique about travel that makes TV a less appealing ad channel? Third, should travel marketers spend more on TV? There are yes’s and no’s to all these questions. Unlike other consumer products, travel is a highly fragmented and personal commodity from the consumer perspective. Will brand awareness of a hotel or a destination make a difference and eventually convert to sales? The answer might be yes, but not with an expensive channel like TV. Beautiful print images for a highly targeted audience might serve the same purpose, with a much lower price tag. That might be why print still constitutes a significant role for the travel sector. On average, the surveyed companies spend 13% of their budgets on magazine and 9% on newspaper. These outlays are much higher than what other industries are spending, especially amidst the deepening struggles faced by the entire print industry.
Despite the somewhat unique nature of the transaction-driven model, TV is still a compelling media outlet to reach the mass if used properly. While targeting and personalization are tuning into individual needs and likes, the reason Facebook and the Super Bowl thrive is the human desire to be part of a crowd, as much as we would like to deny it. What’s more compelling than a travel story well told to millions of people watching it at the same time? The key is that it needs to connect and inspire. In addition, the traditional TV market is moving fast. Cable and network providers are all figuring out how to utilize digital channels to make TV a more compelling and measurable channel. Addressable TV and programmatic buying, while still nascent, have the potential to keep TV relevant.
Search and social are predominant digital channels for travel marketers
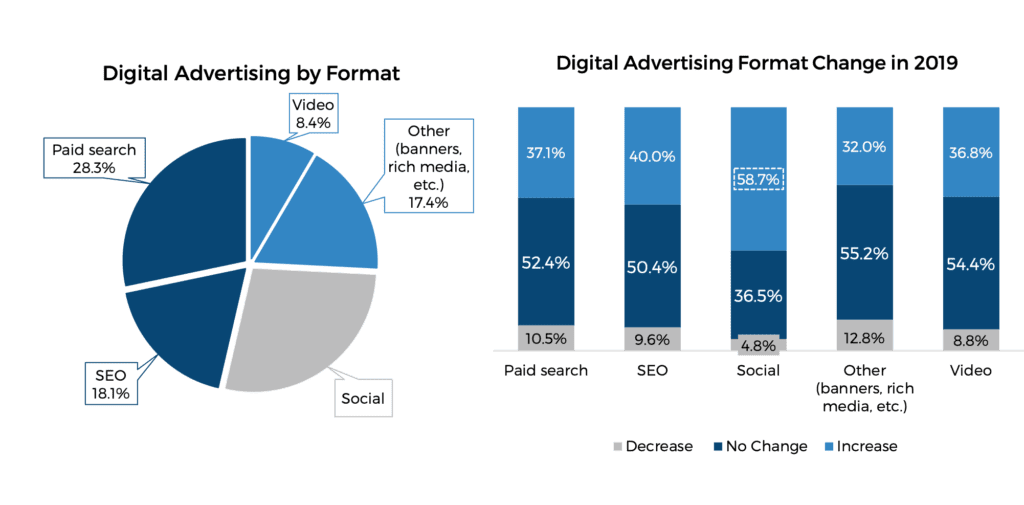
Travel marketers spend nearly 50% of their digital advertising budgets on paid search and search engine optimization (SEO) efforts. While this combined share is in line with the broader advertising trends, it should be noted that on average, travel companies spend only 28% of their budget on paid search and a whopping 18% on SEO. That’s a pretty imbalanced share, with much more weight on SEO than the total ad market. Keep in mind that for the total search and SEO pie, Google makes up about 85% of the market.
When the Online Travel Agencies (OTAs) enter in mix, everything starts to make sense. Expedia Group and Booking Holdings, the world’s largest OTA conglomerates, spent nearly $8 billion on advertising in 2017, a majority of which went to Google AdWords. In the first of our three-part OTA report series, “The State of Online Travel Agencies 2018 Part I: Advertising”, we delved into the OTA model from an ad spending angle and concluded that OTAs are essentially consolidators of and clearinghouses for advertising dollars in the travel market. By heavy investment in search and metasearch platforms, they dominate the first touch points at the bottom of the purchase funnel. The scale advantage they create through this model is hard to compete with.
While they might be hard to compete with, travel companies can certainly benefit from this through the “billboard effect.” A typical traveler visits multiple sites before making the final purchase. Building a compelling site and participating in the OTAs can drive more direct bookings.
Social media accounts for 28% of digital advertising budgets for travel companies, on par with the broader ad market. A large majority of this is spent on Facebook and Facebook-owned Instagram. When asked about 2019 planning, 59% of surveyed travel marketers say they will increase spending on social media advertising, the highest growth rate among all digital channels. Travel is a sector that Facebook has been investing in heavily. After launching “Dynamic Ads for Travel” last year, which helps retarget visitors to various sites, they rolled out “Trip Consideration” in March 2018 to help travel companies identify and target potential customers even before the planning stage of travel. While taking advantage of these initiatives, it’s also crucial for travel companies to integrate their organic social presence and user generated content with paid advertising to create a seamless social experience for customers.
Digital video has been growing exponentially in the past few years as a viable ad format, as more and more people turn to digital channels for video content. Travel marketers spend 8% of their digital budget on video ads, with 37% stating they plan to increase that budget in 2019. As we discussed above, TV is a relatively lesser utilized channel for travel marketers, which might help explain why the investment in digital video is also low relative to the overall market. Yet, travel purchases are typically more emotional and personal purchases compared to other consumer sectors, and video, when well executed, can tell the most compelling stories and make the most emotional connections. As consumers increasingly switch between various screens and providers to access video content and as multi-screen ad targeting and measurement tools continue to mature, travel marketers should consider investing more in the video space.
Outside the formats dominated by Google and Facebook, travel marketers spend 17% of their budgets on smaller digital outlets, which typically include banners, rich media, classifieds, audio, and lead generation formats.
Source: Skift Research
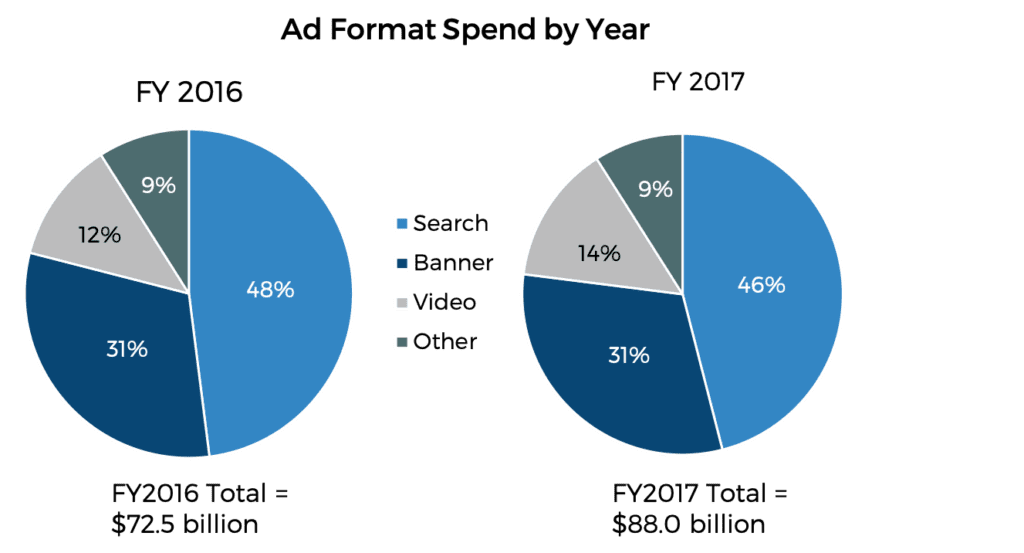
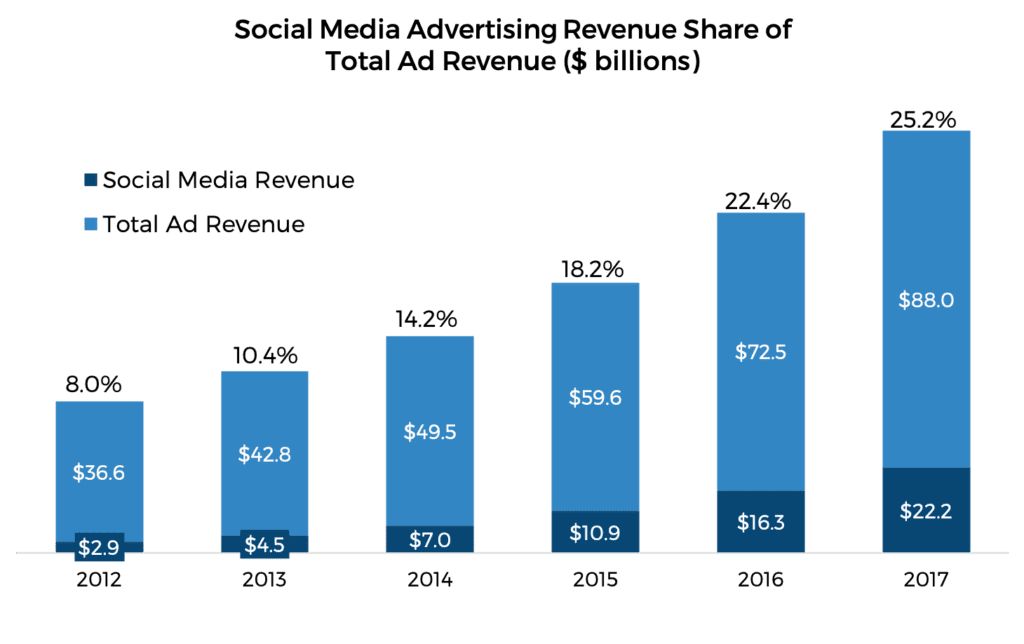
The following is the data from the Interactive Advertising Bureau (IAB), the digital advertising trade organization, on the general ad market. From the revenue side of media advertising companies, search accounted for 46% of total digital ad revenues; banner (which includes banners, rich media and social networks) accounted for 31%; video 14%; and other (audio, classified, lead generation, etc.) 9%. Social network ads, which encompass various ad formats such as text, banners, rich media, and video, had grown to 25% of the total digital ad market in 2017.
Travel marketers spend 45% of digital advertising budgets on mobile and will continue the shift to mobile in 2019
Various sources put out estimates of the number of hours we spend with our mobile phones. While they all differ, the consensus is average smartphone users spend at least three hours on their phones per day and this number is increasing.
As travel is usually expensive and requires a long period of research before decisions on purchases are made, the majority of online travel booking is still done on laptop/desktop computers. However, mobile is on its way to becoming the first screen for consumers, especially younger generations, and in many emerging consumer markets such as China and India, mobile-first is already prevalent.
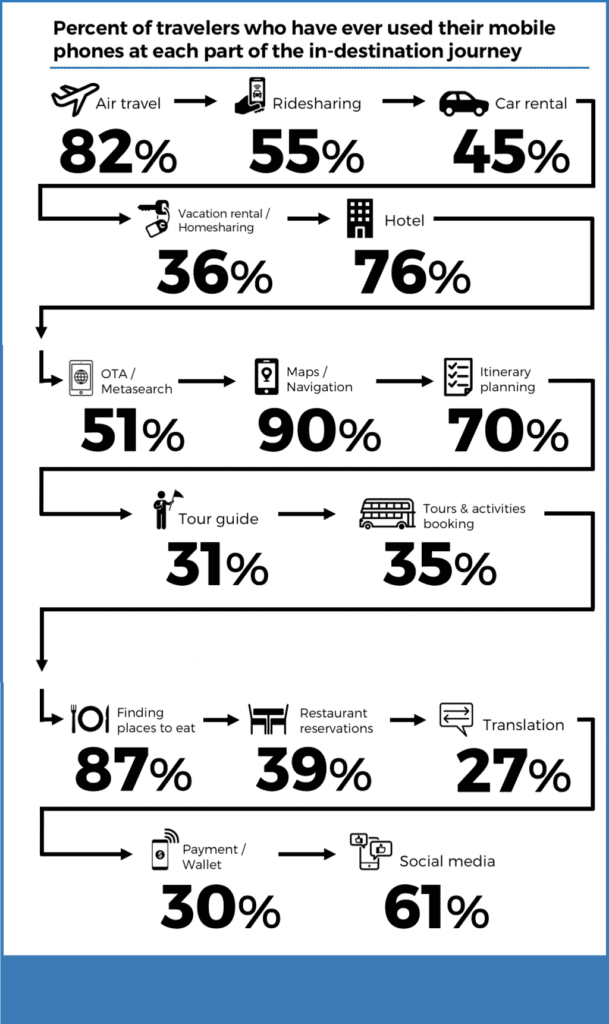
Earlier in 2018, Skift Research conducted a survey on in-destination mobile use to understand the scope of mobile usage related to various activities when travelers are in a vacation destination. We find heavy reliance on mobile phones at every stage of in-destination journey, which creates immense opportunities for relevant travel companies to market and serve them (see “U.S. Traveler In-Destination Mobile Usage Survey 2018” for more details). Travel marketers need to take steps to create a mobile first strategy instead of treating mobile as an extension of computers.
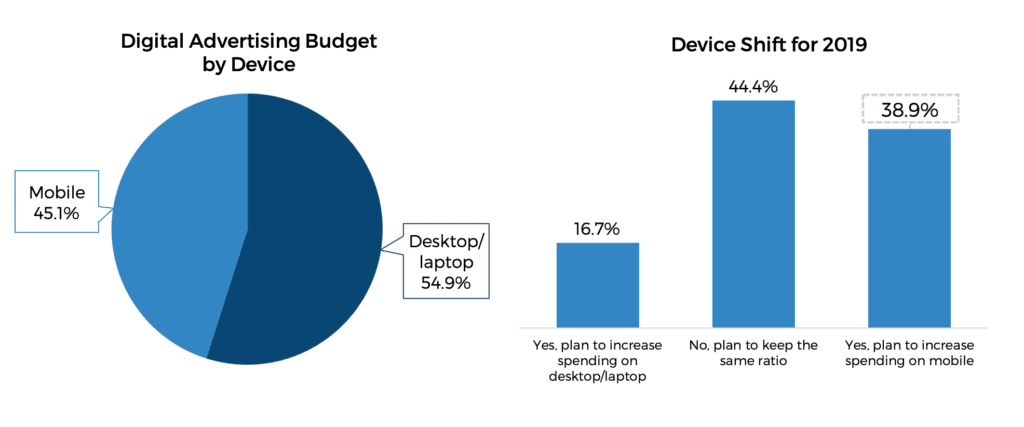
On average, travel companies spend 45% of digital advertising budgets on mobile, on par with other consumer sectors. For 2019, 39% of them expect to increase spending on mobile, with 17% expecting to increase spending on laptop/desktop devices, and another 44% stating they plan to keep the same ratio.
Source: Skift Research
All digital advertising formats are rated as more effective in delivering respective ROIs than traditional advertising channels
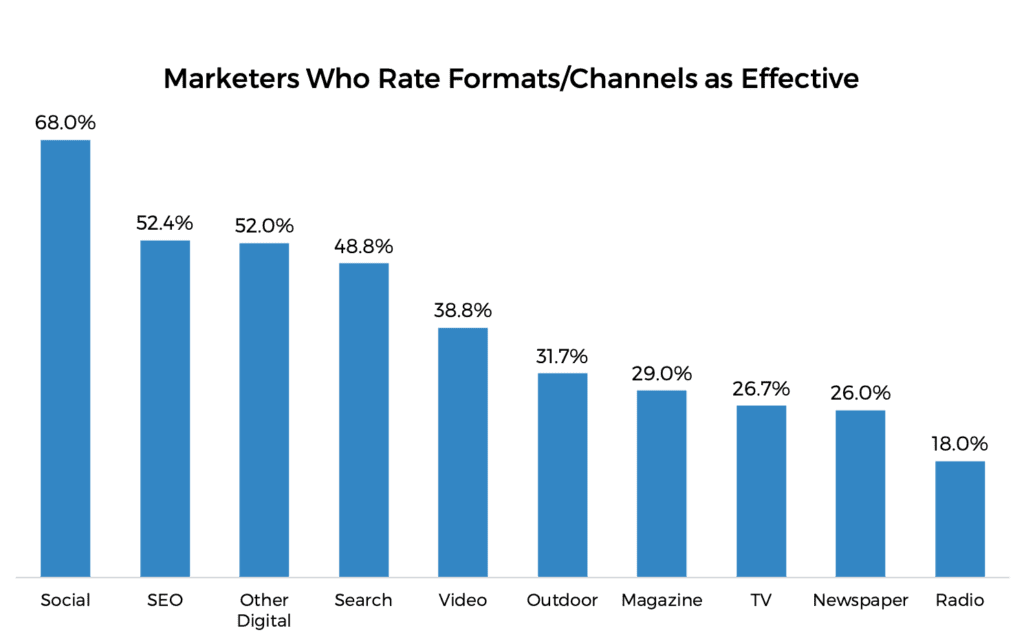
We asked survey respondents to rate effectiveness of all ad formats/channels. All digital formats are rated more favorably than non-digital channels in delivering desired ROIs: 68% rated social as somewhat effective or very effective; 52% rated other digital and SEO as somewhat effective or very effective. We’ve already noted that travel marketers spend very little on TV ads. When looking at performance, we can see that they don’t think TV is a very effective channel either. Only 27% rated TV as effective, the same number as those who rated newspaper as effective, and slightly lower than the number who rated magazine as effective.
When asked to select the top three most effective formats/channels, however, there is some shift in order. Social, paid search and SEO are selected by the most respondents as the most effective.
These are all very encouraging numbers for implementing a digital-centric advertising strategy. Gone are the days when marketing was measured by gut feelings more than anything else. Modern CMOs and their teams are increasingly taking on central roles of driving business growth. According to a combined study of global marketing executives by CMO Council and Deloitte in December 2016, 70% of senior marketing executives said there was a clear mandate from the C-Suites for marketing to be the growth driver and business value creator in their companies. To drive revenue growth means marketers first need to tie their marketing and ad spending directly to sales. The evolution of digital channels and data accumulated in digital environments have greatly empowered marketers to apply better metrics to measure success. Clicks, traffic, conversions, and revenues are widely adopted metrics to measure effectiveness. For any ad campaign, it’s essential to identify the right success metrics, test, evaluate success, and optimize to ensure maximal results.
On the other hand, this doesn’t mean marketers should simply stop using all the traditional channels. Lack of proper performance measurement tools and metrics might be big factors contributing to lower effectiveness ratings. Understanding what your core target audience is following in their media habits is the first step to making decisions on media investment. As newer technologies connecting offline and online worlds continue to emerge, there will be better, digitized tools to measure offline ad campaigns.
Finally, a potential pitfall that all travel marketing executives should avoid is to solely focus on metrics without thinking of the long-term growth strategy. As discussed below, understanding customers and providing the best value for them should be the core ingredients throughout all marketing strategies and tactics. Only by doing so can a company achieve sustainable growth.
More than half of travel companies haven’t integrated digital advertising teams into overall advertising teams, which creates a huge barrier to multichannel strategies
How a marketing team is structured reflects the company’s overall business strategy and can greatly impact marketing performance. While crucial in a marketing team’s advertising strategy, digital should be an integral part of the overall media plan. Well-planned and -executed, multichannel campaigns can amplify the effectiveness of each individual channel/format more so than is possible when they are executed alone.
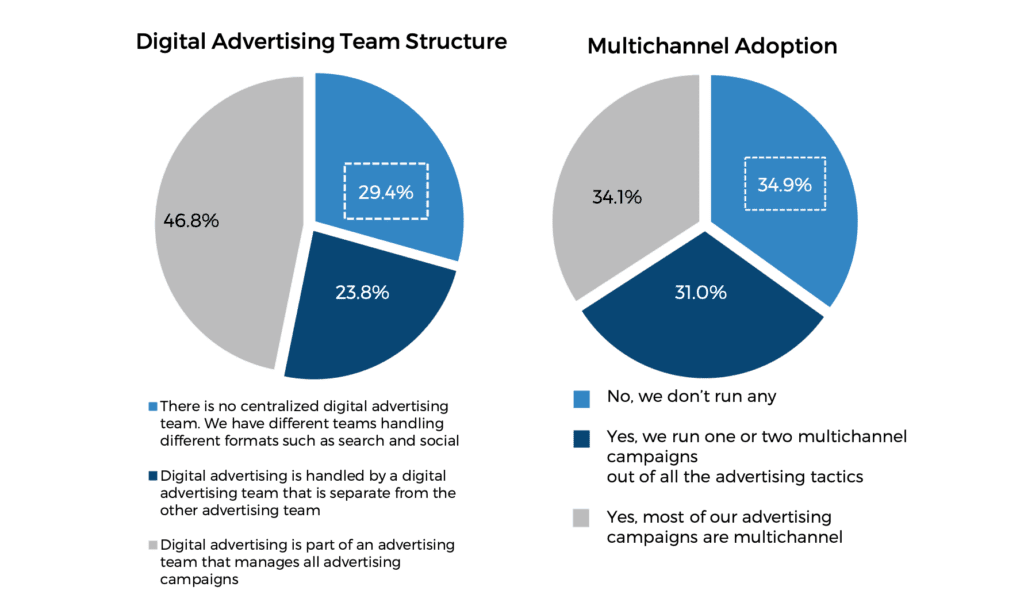
While 47% of travel companies surveyed have a centralized advertising team which encompasses digital and other ad channels and formats, 24% of them have separate digital advertising teams, and another 29% have different teams handling various formats and channels.
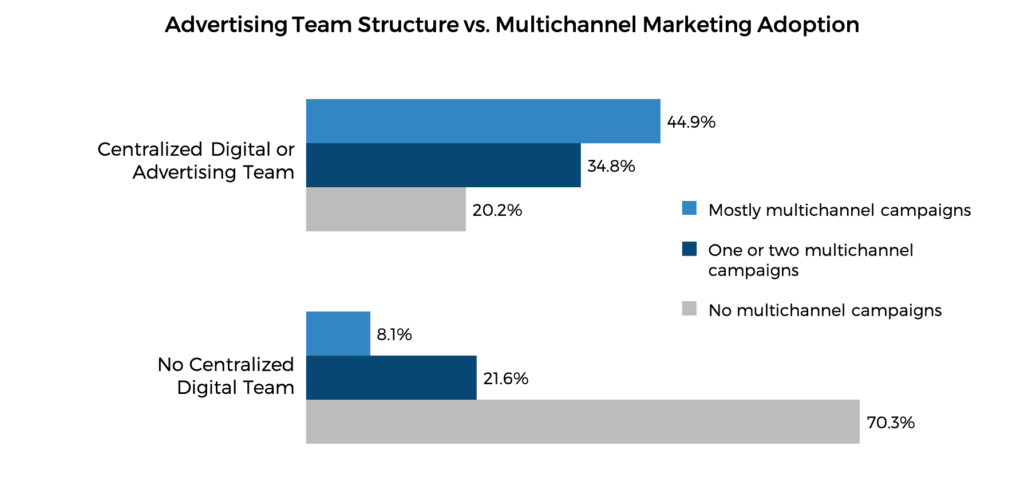
For companies with no centralized digital or advertising teams, 70% have never run any multichannel campaigns, 22% have run one or two multichannel campaigns out of all ad investments, and only 8% say most of their ad campaigns are multichannel. This is in stark contrast to companies with centralized digital or advertising teams, where only 20% have never run any multichannel campaigns and 45% run most of their ad campaigns in a multichannel fashion.
Adoption of Customer Journey Mapping in Marketing Budget Allocation
While the concept of branding and direct response has been the center of marketing since the inception of modern marketing, customer journey mapping is relatively new, a result of the proliferation of interaction points and the explosion of data accrued in the digital world. Using customer journey mapping in marketing planning can provide great clarity on the business goals and corresponding tactics best suited to achieve the goals.
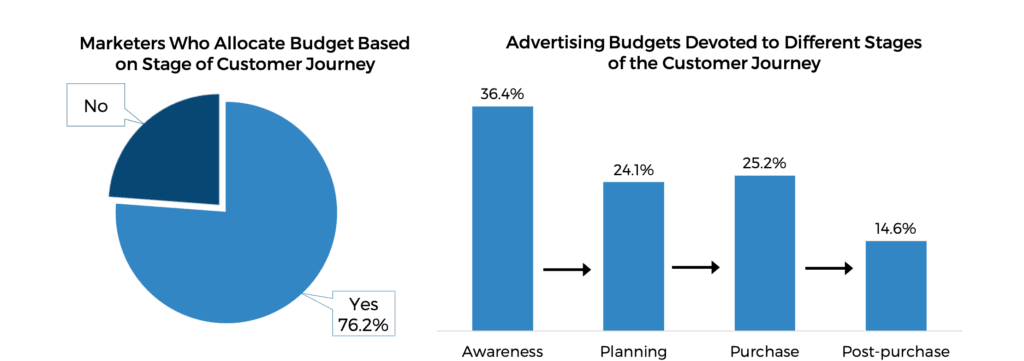
Seventy-six percent of travel marketers surveyed indicate they’ve already implemented customer journey mapping and allocate budget based on journey stages in marketing planning. Of the total ad budget, over one-third is spent on the awareness stage, 24% on the planning stage, 25% on the purchase stage, and 15% on the post-purchase retention stage. Awareness and planning combined account for 60% of the total ad budget, indicating heavy investment in the top of the marketing funnel.
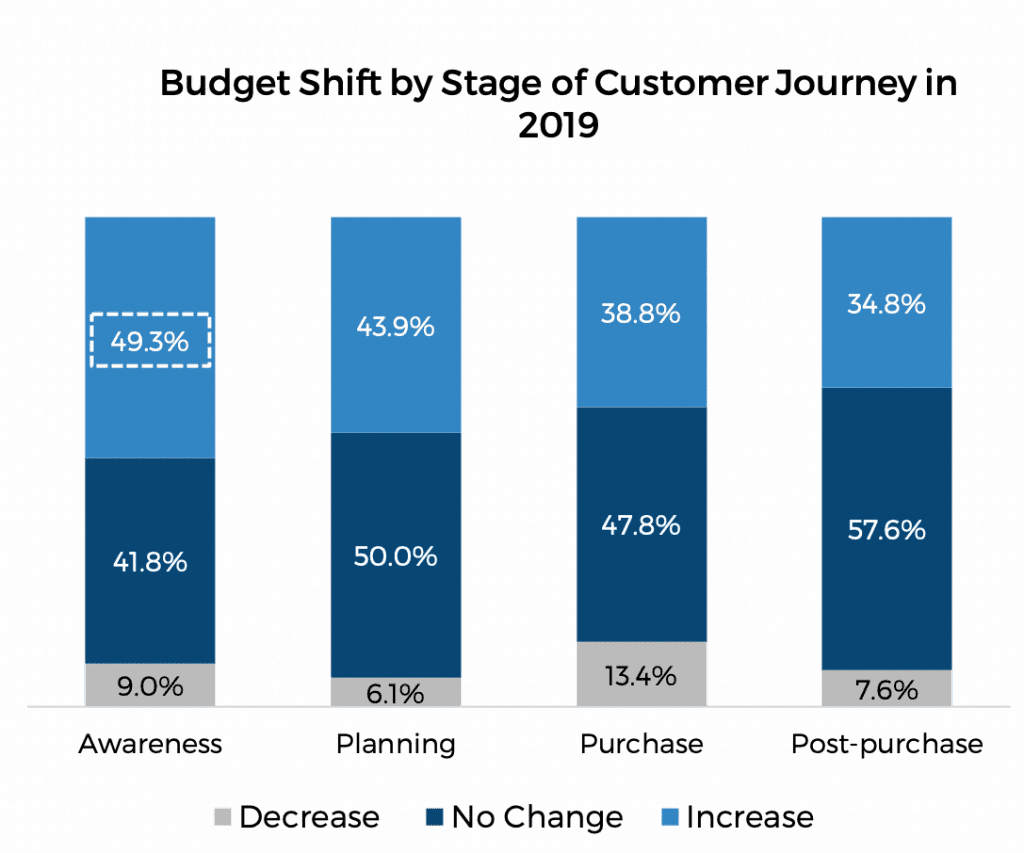
The top-of-funnel priority will continue in 2019. Forty-nine percent of surveyed travel companies plan to increase ad budget on the awareness stage in 2019 and 44% plan to increase ad budget on the planning stage, higher than the other stages.
This top-funnel focus is reflected in the heavy marketing investment in marketing expansion through acquiring new customers, as revealed below. There are a couple of considerations with this top-funnel focus. First, top-funnel tends to be more expensive, as it requires reach and scale. Second, post-purchase marketing is heavily driven by owned and earned channels such as email and content marketing. Given that context, having 15% of total ad budget devoted to post-purchase is not an insignificant number.
While the numbers are important in setting up a strategy, marketers should not overlook the the whole customer journey. After budget decisions are made about investment in various touch points, it’s essential to create an integrated campaign and deliver a seamless customer experience throughout the customer journey for a successful campaign.
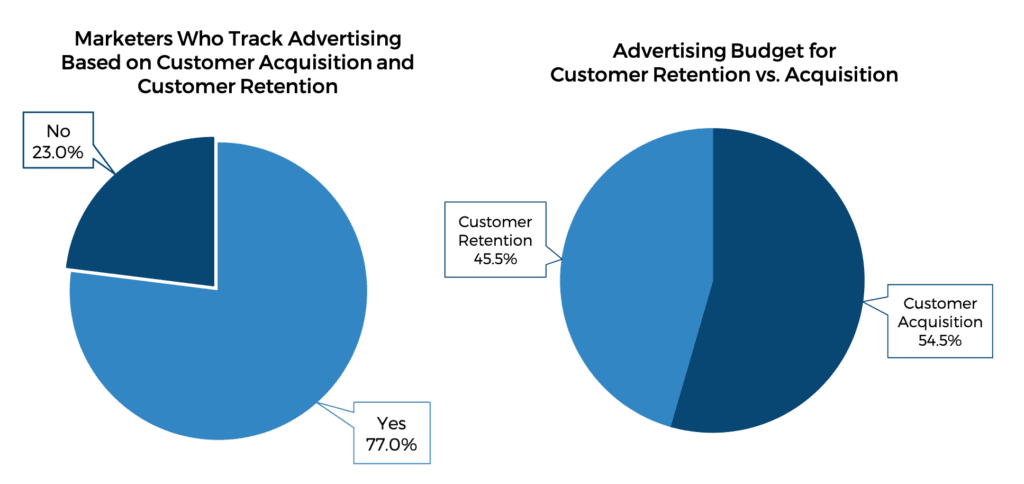
Congruent with the customer journey mapping consideration in ad strategy, marketing teams are increasingly asked to focus on one or both of the following two missions: acquiring new customers and retaining (and growing) the existing customers. Seventy-seven percent of surveyed travel marketers are already planning their ad spending around these goals and 23% have not yet done so.
Echoing the journey stage budget allocation, travel marketers spend more marketing budget on acquiring new customers than retaining existing customers, with 55% spent on acquiring new customers and 45% on retaining existing customers. This seems to be the common anxiety that many CMOs across all industries are facing: grow into new markets and generate revenue through market expansion. Similarly, a poll by the CMO Club finds that 66% of the CMO Club members spent less than 30% of marketing budget on customer retention.
Source: Skift Research
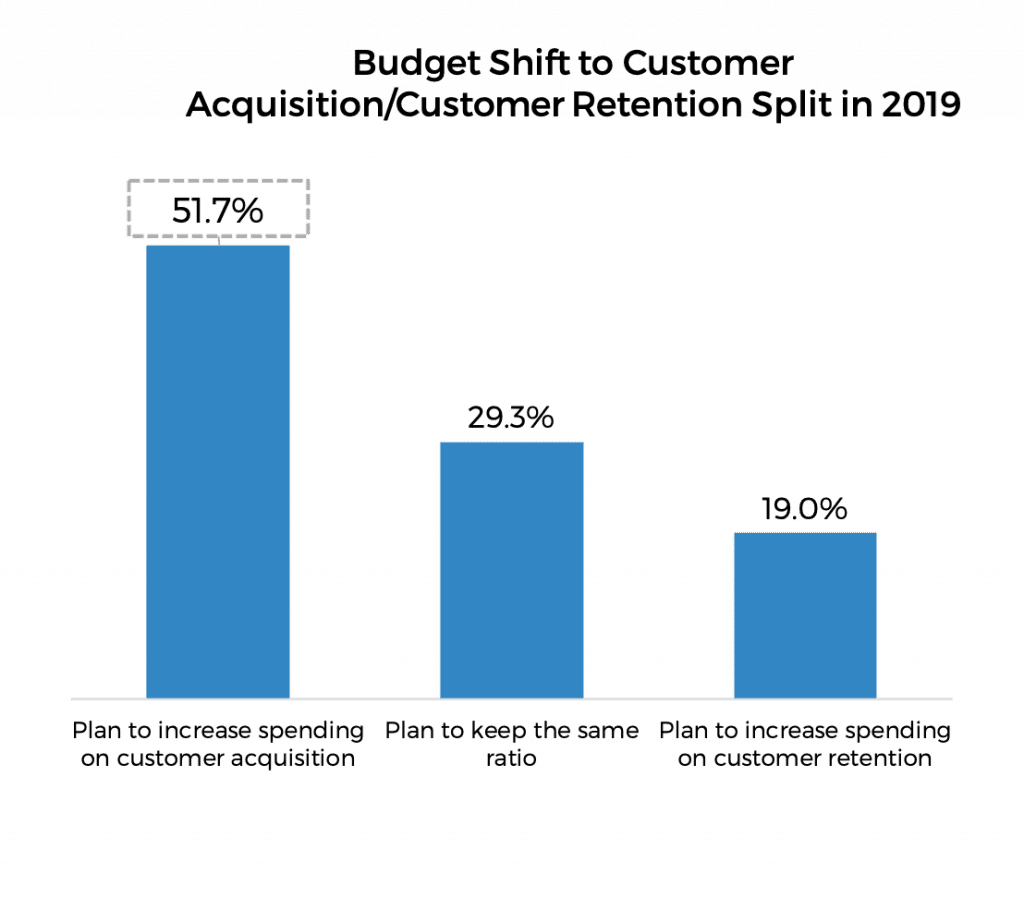
The greater focus on market expansion and customer acquisition will continue in 2019. Among the surveyed marketers in Skift Research, 52% plan to increase spending on customer acquisition and only 19% plan to increase spending on customer retention.
Earlier in 2018 we reported that despite tremendous membership growth in hospitality loyalty programs, overall usage is low and price is still the number one consideration for customers making booking decisions. And emotional connection, which is a key to true consumer loyalty and revenue generation, is very low for travel sectors. According to research by Customer Thermometer, 1% of men and 3% of women felt an emotional connection to hospitality brands and only 2% of both men and women felt this way toward airline brands. This is compared to 9% and 33% respectively for electronics brands. (See “Perspectives on Hospitality Loyalty Programs 2018: A Challenging Road for Real Customer Loyalty” for more details.)
This is one of the biggest challenges that travel marketers need to tackle. Various research has shown that a loyal customer makes more purchases, serves as a brand ambassador, and costs less to market to. Making efforts to establish a brand that resonates with your core consumers by understanding their major pain points and providing relevant solutions will get you far in increasing the lifetime value (LTV) of your existing consumers.
This is one of the biggest challenges that travel marketers need to tackle. Various research has shown that a loyal customer makes more purchases, serves as a brand ambassador, and costs less to market to. Making efforts to establish a brand that resonates with your core consumers by understanding their major pain points and providing relevant solutions will get you far in increasing the lifetime value (LTV) of your existing consumers.
Adopting Advanced Performance Measurement Tools
Adoption of multichannel campaigns, which are meant to reach consumers at various touch points throughout their entire purchase journey, is becoming mainstream,. The next natural step is to determine how to measure the success of each channel/format used in a marketing campaign. Hence the rise of multi-touch attribution. Traditionally, the effectiveness of a specific ad placement is measured alone, by the last click. For instance, if a customer clicks on a link from a paid search ad by a boutique hotel, that paid search ad gets all the credit for the click. While in reality, the reason the customer chooses that link above others is because a TV ad by the hotel s/he saw the night before or a picture of the hotel that strikes her/his attention when s/he browsed their social feeds a week ago. With last-click attribution, all of the impact from TV or social media is unrealistically zeroed out, and leads to over-valuing paid search, and under-valuing other channels. Thanks to all the data that’s available about all these actions that the customer took, a powerful multi-touch attribution model patches all the touch points together and assigns appropriate credit to all the touch points for the final success metric, which is usually conversion/sales.
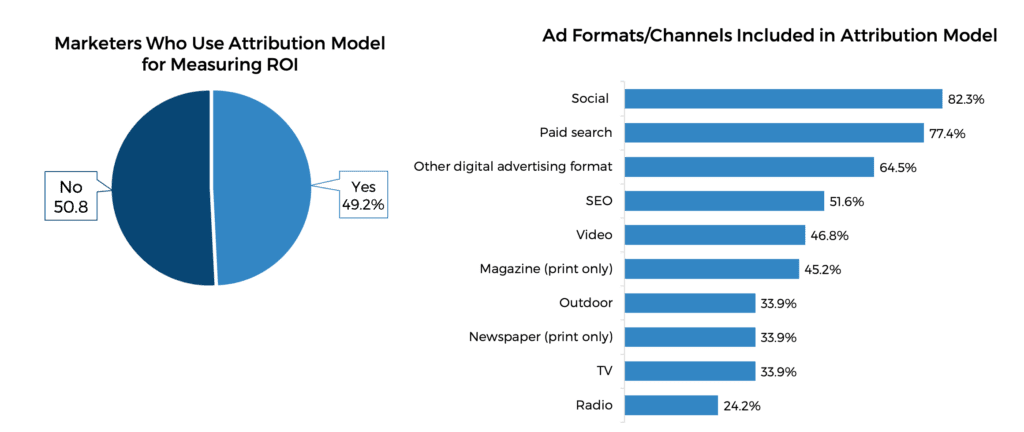
Roughly half of marketers surveyed have already adopted some level of multi-touch attribution for measuring ROI. Social, paid search, and other digital ad formats (banners, rich media, classified, etc.) are the most frequently included formats in attribution modeling. This is clearly the result of the heavier investment in, and the availability of data in these formats.
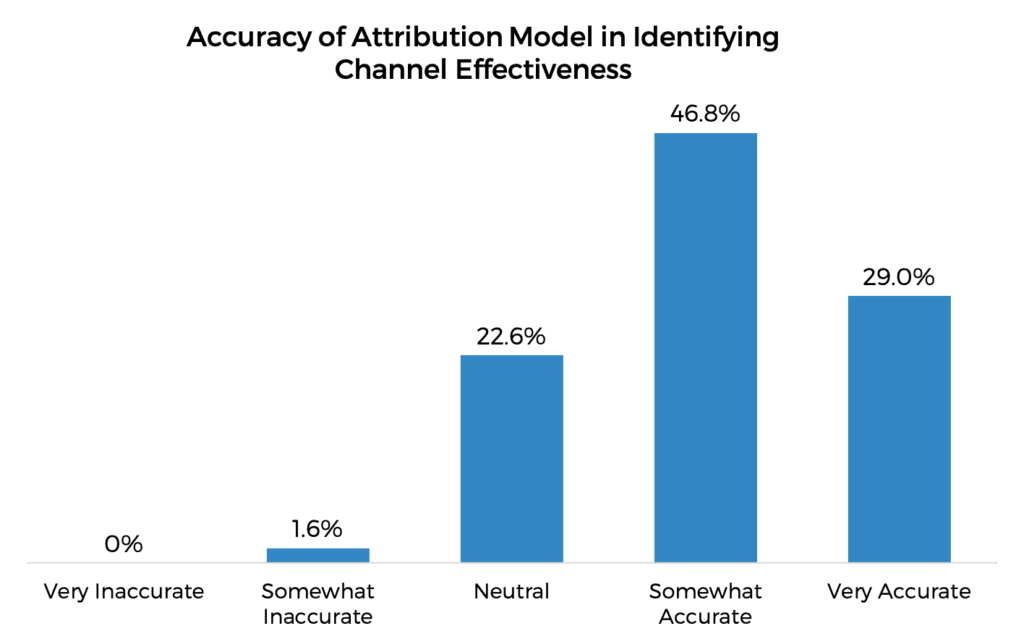
The overall attitude about the attribution technique among travel marketers is positive. Seventy-six percent of the marketing professionals surveyed believe the attribution technique they use is at least somewhat accurate in attributing the right credit to included formats/channels. This is encouraging news amid market troubles around capabilities and vendor fragmentation. While the market might take some time to mature and scale, smart travel marketers shouldn’t wait until it is fully developed to adopt the technology. Investing and iterating now will put you ahead of the curve.
2019 priorities and challenges
As 2018 draws to a close, all companies and marketing teams are working on creating the big picture of business goals and corresponding marketing goals and strategies. Reflective of the customer acquisition focus noted above, acquiring new consumers will continue to be the core marketing focus for travel marketers. Of all the marketing executives surveyed, 75% indicated acquiring new customers is a top three marketing priority for 2019, with building brand awareness (60%) and growing revenue (59%) being the other two.
Down to the tactical side, as we reported above, 2019 will see continued investment in marketing technology and advertising. And when it comes to advertising budgets, digital will continue to gain share, at the cost of all the traditional media outlets. Ad spending on Facebook and Google will still outpace spending on the rest of the digital media world. With this growth comes the pressure to deliver results. Travel marketers will continue to invest in data and measurement tools to optimize ad performance. With the myriad of services available, the challenge is how to identify the right tools and channels. It’s not surprising that the consensus among the surveyed marketers on the top three marketing challenges for 2019 is identifying the best advertising formats/channels (70%), lack of budget (64%), and identifying the right ad tech tools/vendors (51%).
Reduce Ad Waste and Deliver Optimal Results
Get Clarity on Business Goals and Identify Appropriate Success Metrics
This might sound commonsensical, but many marketing organizations don’t have a clear mandate on what’s regarded as successful, which causes huge wastes of marketing investment. As mentioned above, increasingly, marketing teams are tasked to lead business strategies and drive business growth. Yet there are varying business focuses and growth visions. For examples, imagine there are two equally profitable tour operators with similar customer profiles. The C-Suites of the first company wants to expand market share by acquiring new customers, and the executives of the second company want to grow revenue through deeper engagement with existing customers. The CMOs of these two companies clearly have different goals to achieve. It’s crucial to sync with the senior executives to decide on and get clarity on the overall company vision and strategy.
Only after that can you identify the appropriate success metrics. Going back to the example of the two tour operators, for the first CMO, the success metric might be brand lift, and for the second, the success metric might be an increase of loyal customers.
Select the Right Media Mix to Deliver Success
What are the right channels to achieve the goals? How much should we spend on each channel? Do we have the right measurement tools? How do I know I am using the right channels? These are all the questions that marketers need to constantly ask themselves throughout the campaign management.
Highlights in Channel Selection
Programmatic – Programmatic campaigns have completely revolutionized digital ad buying by introducing real-time targeting and measuring capabilities to digital ad placement. However, programmatic advertising has been under attack for the last couple of years due to controversies over ad fraud and ad viewability. As a result, many high-profile enterprise companies have pulled back on programmatic ad spending or have decided to build in-house programmatic capabilities. In travel, for instance, Radisson announced that it hired Accenture Interactive Programmatic Services as its global digital agency of record to bring programmatic buying in-house, as an effort to take back control of media capabilities and better manage marketing and consumer engagements. While building an in-house team might not be a viable step for many smaller-scale companies, there are many things that you can do to reduce ad waste due to ad fraud and low viewability. Reduce spending on open marketplace which normally entails long-tail low-quality inventories. Work with premium publishers through programmatic direct or private marketplace and keep a close eye on performance metrics.
Native advertising – Native advertising, an ad type that resembles the content or surrounding environment of the ad, has shown to be less intrusive and perform better than other ad formats. Consider using native advertising whenever appropriate, by creating more relevant content in the right context.
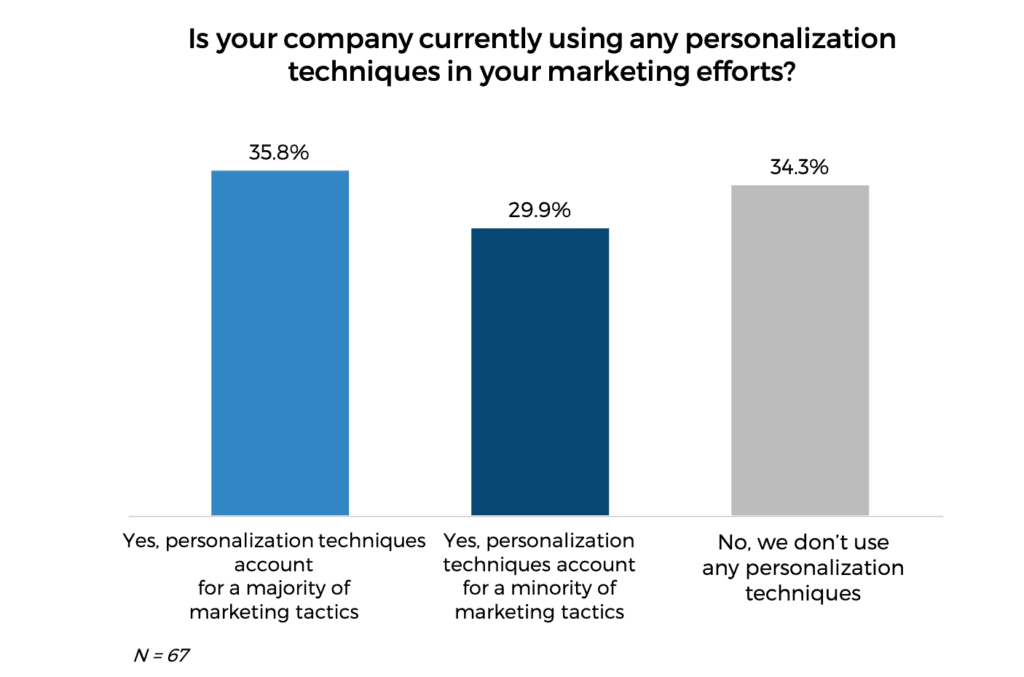
Targeting and personalization – With the large amount of first-party and third-party data available, ad targeting is already a widely adopted practice, and personalization is also on its way to becoming mainstream. Skift Research conducted a survey of travel marketers in May 2018 focusing on adoption of personalization techniques. About two-thirds of respondents said they had already used at least some level of personalization in their marketing efforts.
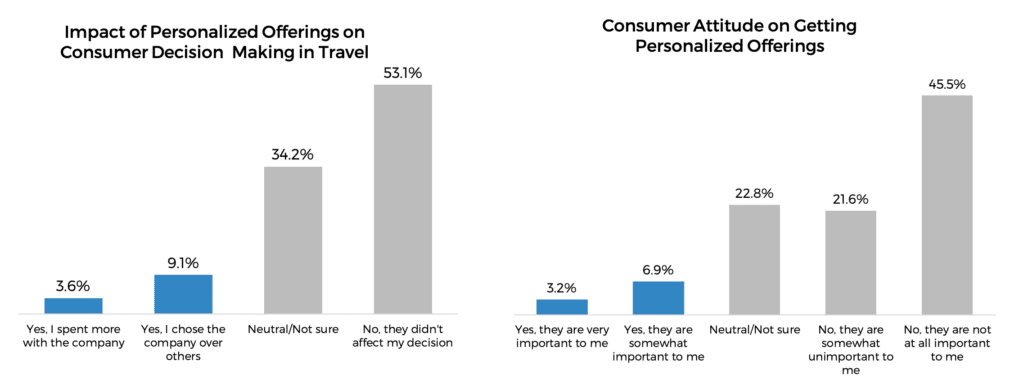
Yet, there is huge room for improvement on both the technological end and the execution end. When we asked consumers about their behavior and attitudes around personalized travel marketing messages, the results are far from positive. Only 6% stated they spent more with a company, and only 9% stated they chose a company over others, because of personalized messages. And only 12% said getting messages specifically tailored to them was somewhat important or very important to them. All these point to a clear disparity between adoption and effectiveness.
Many personalization efforts rely on third-party data or first-party transactional data. To truly deliver meaningful and personalized messaging requires more than that. Travel marketers need to patch in more first-party consumer insight data and build more accurate personas into execution channels.
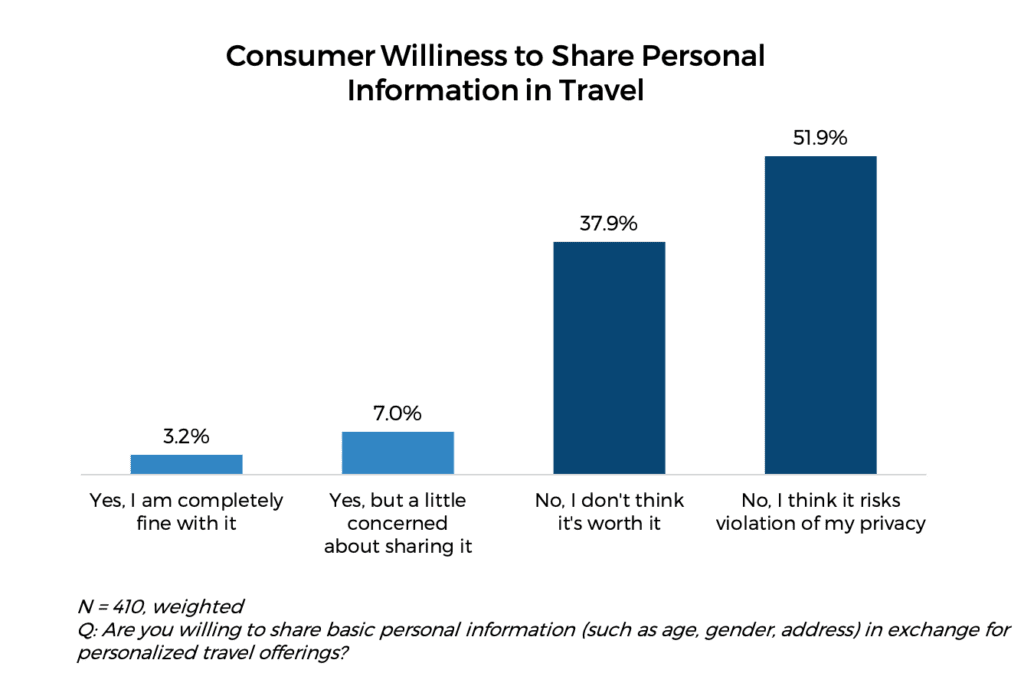
Data security and transparency – Besides GDPR compliance, consumers’ trust of companies’ usage of their personal data has reached a low point. In the same survey on consumer attitudes of personalized offerings noted above, we asked travelers if they’d like to share basic personal information in exchange for tailored and personalized travel offerings. Only 3% said they were completely fine with it; 7% said they would share, but were concerned about it. On the other end of the spectrum, 38% didn’t think it was worth it and 52% believed it risks violating their privacy. In the midst of all the recent high-profile data breaches, gaining consumer trust is even more important. Invest in data security and be transparent with consumers on how you collect and use their data.
Test, measure and iterate – This seems commonsensical in modern marketing. But surprisingly, it still presents a huge hurdle for generating the best outcome. Take great advantage of the data analytics and measurement tools. Keep testing and iterating for optimal results.
Audit and consolidate vendors
Back in 2011, there were about 150 specialized vendors in marketing technology. By 2018, the number ballooned to more than 6,000. Identifying the right tech tools and vendors was identified as one of the top three major challenges for 2019. In scrambling to grow and accrue marketing capabilities, marketers often end up with more vendors than needed and with huge overlaps in functionalities. Auditing and consolidating vendors is not only an effort to reduce cost, but is often crucial to streamline processes and create higher efficiency.
Invest in innovative technologies
Keep abreast of innovative and disruptive technologies in the advertising and marketing space. Set aside marketing budget to invest in and experiment with new technologies. For instance, we are seeing some early-stage testing of tools that use artificial Intelligence (AI) based technology in predictive advertising. When combined with more robust consumer data patching, AI-assisted predictive advertising is aimed at targeting the right audience at the right time based on their previous behavior. And augmented reality (AR), virtual reality (VR), and voice assistants offer some interesting testing grounds for new ad formats/channels.
Highlights for Select Sectors and Company Revenue Sizes
To conclude, we highlight how different travel sectors and companies with different revenue brackets spend their marketing and advertising budgets. We note this shouldn’t be interpreted as representative of each specified segment, due to the small sample size of each segment. Yet this gives us a glimpse of sector variations due to their business focuses, models, and marketing positions. We only present data if a segment has at least 10 respondents.
By Select Travel Sector
Marketing Budget Allocation
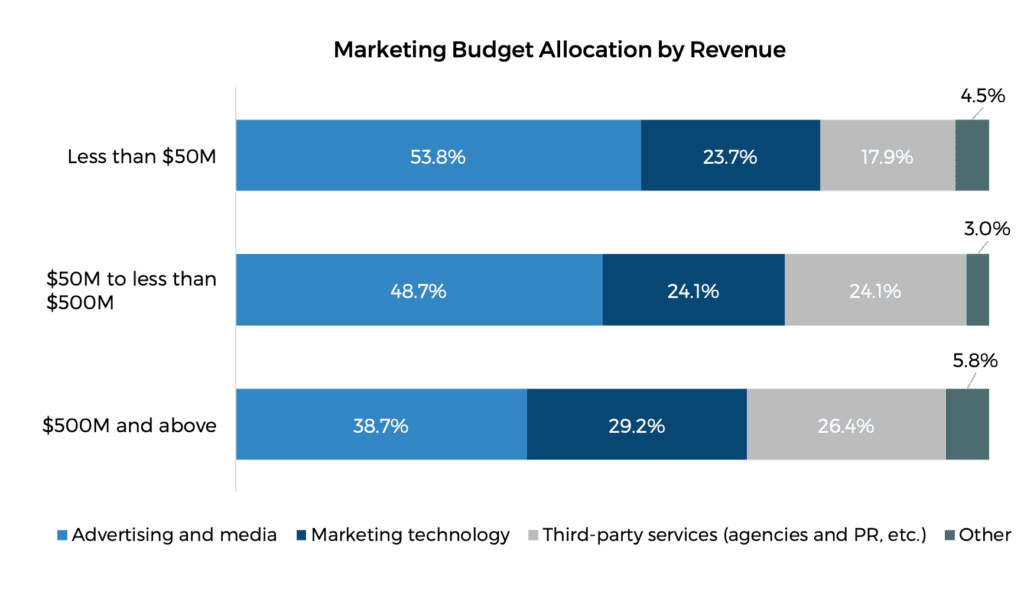
- Traditional travel agencies, tour operators/wholesalers, and destination and tourist attractions spend more on advertising and media than other sectors.
- Independently owned hotels, branded hotels, and traditional travel agencies spend more on marketing technologies than other sectors.
- Corporate travel and events, independently owned hotels, and branded hotels spend more on third-party services than other sectors.
Digital and TV Ad Budget Allocation
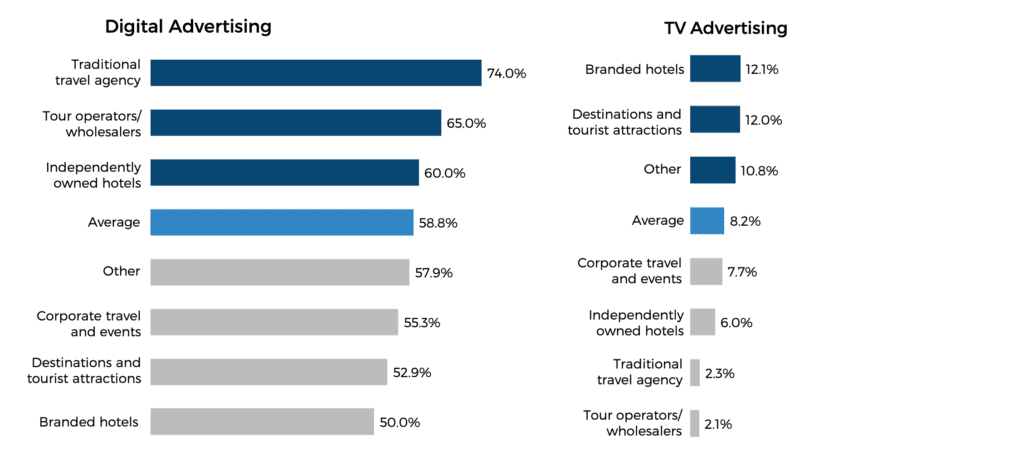
- Traditional travel agencies, tour operators/wholesalers, and independently owned hotels spend more on digital advertising than other sectors.
- Branded hotels and destinations and tourist attractions spend more on TV advertising than other sectors.
Digital Advertising Budget Allocation
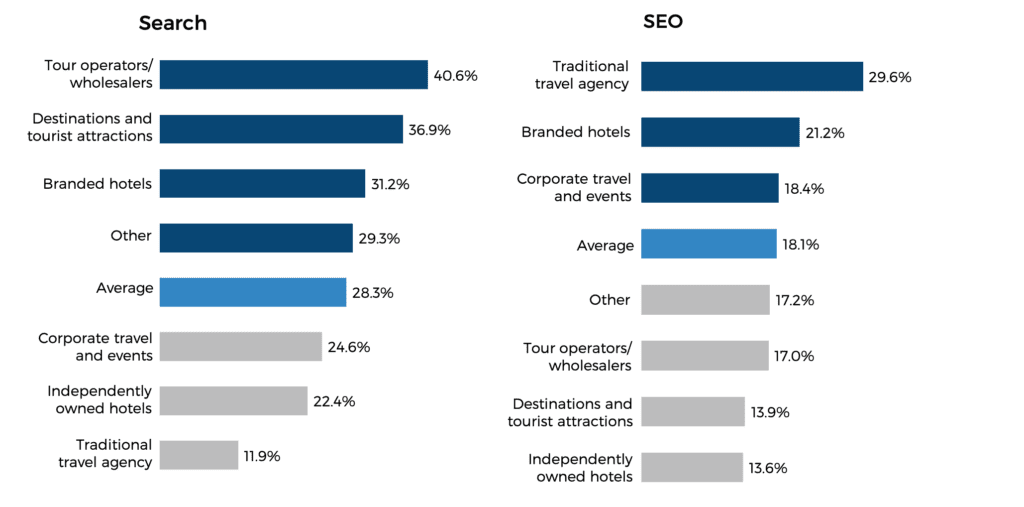
- Tour operators/wholesalers, destination and tourist attractions, and branded hotels spend more on paid search than other sectors.
- Traditional travel agencies, branded hotels, and corporate travel and events spend more on SEO than other sectors.
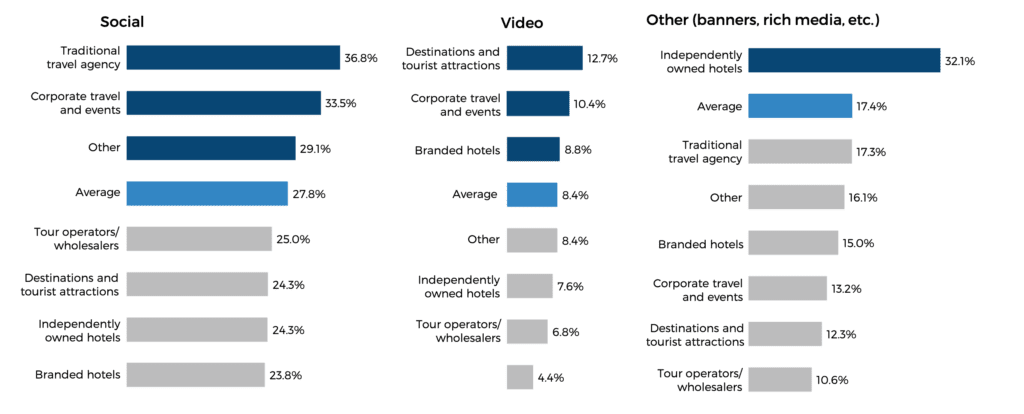
- Traditional travel agencies and corporate travel and events spend more on social than other sectors.
- Destination and tourist attractions, corporate travel and events, and branded hotels spend more on video than other sectors.
- Independently owned hotels is the only sector that spends more than average on banners, rich media, and other digital formats.
By Company Revenue Size
Marketing Budget Allocation
- Companies with annual revenue of less than $50M over index on media and advertising spending.
- Companies with annual revenue of $500M or more over index on marketing technology spending.
- Companies with annual revenue of $50M to less than $500M and $500 or more over index on third-party services spending.
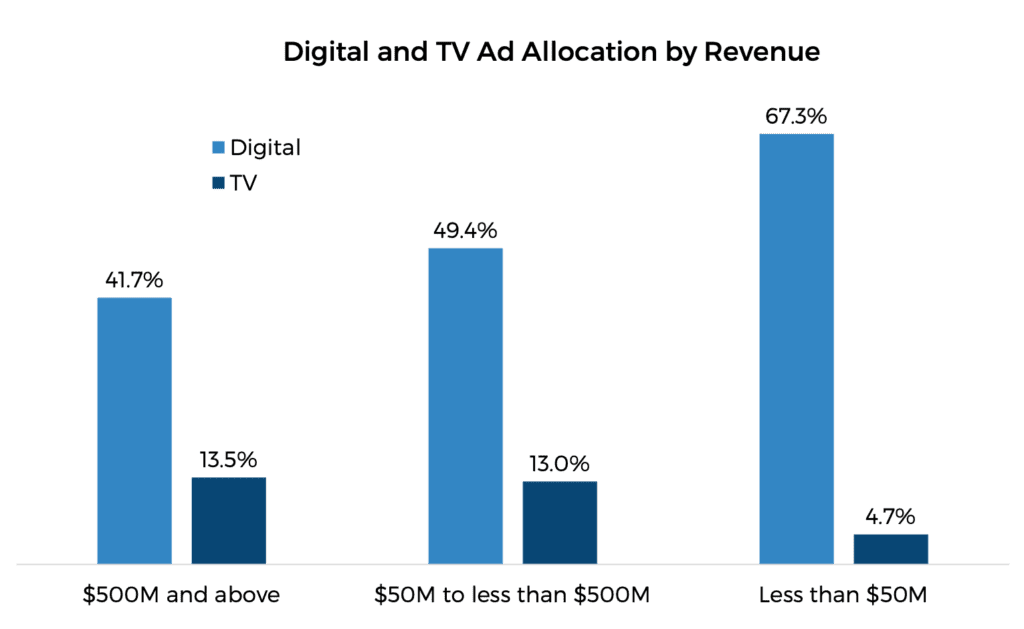
Digital and TV Budget Allocation
- Companies with annual revenue of less than $50M over index on digital advertising spending.
- Companies with annual revenue of $50M to less than $500M and $500 or more over index on TV advertising spending.
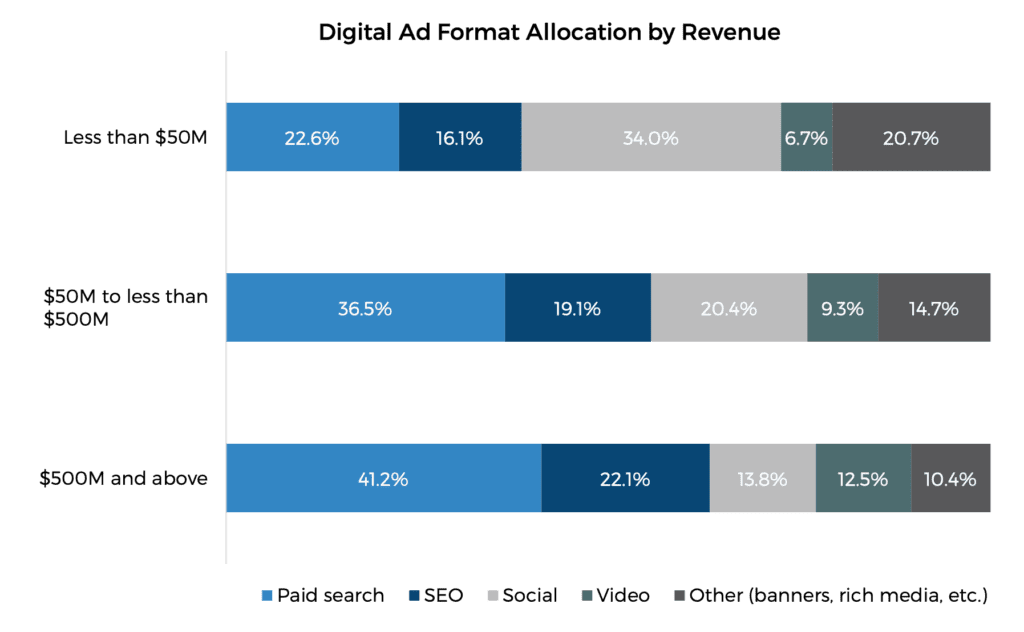
Digital Ad Format Allocation
- Companies with annual revenue of $50M to less than $500M and $500 or more over index on paid search, SEO and video spending.
- Companies with annual revenue of $50M to less than $500M and $500 or more over index on paid search, SEO and video spending.
Appendix: Survey Respondent Demographics
Endnotes and Further Reading
- eMarketer, US Total Media Ad Spending Share, by Media, 2018 & 2022 (% of total), March 2018
- Skift Research, The State of Online Travel Agencies 2018 Part I: Advertising, June 2018
- IAB, IAB internet advertising revenue report: 2017 full year results, May 2018
- Skift Research, U.S. Traveler In-Destination Mobile Usage Survey 2018, July 2018
- CMO Council and Deloitte, Revenue Growth Top Deliverable for Chief Marketers in 2017, 2016
- 60% of CMO CLub Members Spend Less Than 30% of Marketing Budgets on Customer Retention, May 2017
- Skift Research, Perspectives on Hospitality Loyalty Programs 2018: A Challenging Road for Real Customer Loyalty, April 2018
- BusinessWire, Accenture Interactive Programmatic Services Navigates Complexity of Digital Media Landscape, May 2018
- ChiefMartec.com, Marketing Technology Landscape Supergraphic (2018): Martech 5000 (actually 6,289), April 2018

