Methodology
Why Does Travel Need a Stock Index?
The travel sector has seen a dramatic expansion of public companies over the last few years. It started when Airbnb came public in late 2020. What followed were so many public offerings, we called 2021 the year of the travel IPO. Frontier and Sun Country IPO’ed, while the SPAC boom brought Sonder, Inspirato, and Vacasa into the public market, among many others.
This is great news for our industry. The wide range of public companies speaks to Travel’s growing maturity and prominence within the broader business community. It creates a valuable level of standardization and transparency into the financial health of the travel industry. And it provides us with a critical read on investor sentiment vis-à-vis travel.
But even as the number of public travel companies has grown, there was still no major stock index that tracked the performance of the travel industry.
The major hurdle is that travel is not often viewed as a proper industry itself. The global industry classification standard (GICS), which slices and dices major stock indexes into 11 different buckets does not consider travel to be a standalone industry. Instead, the Airlines are shunted as a sub-sector under the broader category of “Industrials.” Hotel brands fall under “Consumer Discretionary,” but hotel owners likely end up as “Real Estate.” Meanwhile online travel agencies fall into the “Information Technology” industry.
None of these are wrong per se, Expedia is a tech company and a Marriott stay is a discretionary consumer purchase. But by scattering travel companies across half a dozen different industries it is hard to take a holistic pulse of the industry or to aggregate financial data in a meaningful way.
The goal of Skift Research’s Skift Travel 200 is to rectify this problem and to build a stock index designed for the travel industry from the ground up. You can think of the Skift Travel 200 as the S&P 500 for the travel industry. The index currently tracks 196 public companies in the travel sector from 34 countries divided into five travel sectors and 14 sub-sectors. The cumulative market capitalization of our travel index is over one trillion dollars.
Market Weighting of the ST200
The Skift Travel 200 is built as a market capitalization weighted index. This is the industry standard methodology for stock indices. Each company in the index has a market value, also called a market capitalization, determined by stock market investors. A market cap is the equity value of each business calculated by taking the share price of each stock multiplied by total shares outstanding for each company.
In this kind of stock cap index each individual company is given a weight based on the relative size of its market value. The change in the price of the Skift Travel 200 is determined by adding up the change in each underlying constituent stock and then weighting those changes based on the relative size of each company.
Change in Index = ∑ Change in Stock * Weight of Stock
As a market capitalization weighted index, the larger a company is, the more of a ‘vote’ it has over what happens to the ST200. This means that Booking Holdings, with a market capitalization of $100+ Billion has more impact on the performance of the overall ST200 than Travelzoo with a market value of ~$90 million.
While this system is less ‘fair’ than an equal weighted average where every company has the same impact, we believe that this is a useful methodology. The reality is that larger companies tend to have more revenue and employees. And they also tend to be less volatile than smaller-cap peers. By using a market-weighted approach, the index is not skewed by a few smaller companies that may see large percentage changes in their value but which don’t have a large overall industry impact.
ST200 Sector Breakdown
| Sectors | Market Capitalization ($M) | Share of Index | Number of Companies |
|---|---|---|---|
| Accommodations | $378,030 | 36% | 81 |
| Global Hotel Brands | $156,440 | 15% | 12 |
| Alternative Accommodations | $96,622 | 9% | 6 |
| Regional Hotel Brands | $45,520 | 4% | 17 |
| Hotel REITs | $45,213 | 4% | 25 |
| Hotel Management and Operations | $21,058 | 2% | 17 |
| Time Shares | $13,176 | 1% | 4 |
| Airlines | $357,936 | 34% | 60 |
| Network Carriers | $259,410 | 24% | 32 |
| Low Cost Carriers | $90,573 | 9% | 22 |
| Other Airline Related | $7,953 | 1% | 6 |
| Travel Tech | $208,427 | 20% | 21 |
| Online Travel | $162,202 | 15% | 15 |
| B2B Tech | $46,225 | 4% | 6 |
| Cruise and Tours | $78,478 | 7% | 18 |
| Cruise Lines | $60,853 | 6% | 4 |
| Tour Operators | $17,625 | 2% | 14 |
| Ground Transportation | $38,212 | 4% | 16 |
Source: Skift Research. Data as of 9/18/2023.
We subdivide the travel industry into five sectors: Accommodation, Airlines, Travel Tech, Cruise and Tours, and Ground Transportation. Each is further subdivided into sub-sectors of which there are 14 in total.
Accommodation is the largest sector within travel. We break it down into six subsectors: global hotel brands, regional hotel brands, hotel management and operations, hotel REITS, alternative accommodations, and time shares.
Airlines are nearly as big. We primarily divide this into two groups: network carriers, the largest single subsector, and low cost carriers. We also have a very minor group of other airline related companies.
Travel tech largely consists of online travel businesses like Expedia Group and Booking Holdings. Online travel is the third largest subsector behind network carriers and global hotel brands. We classify Airbnb under alternative accommodations rather than online travel, though it could arguably fit in either location. The secondary travel tech subsector is B2B tech which includes global distribution systems, property management systems, corporate travel agencies, channel managers, and the like.
Cruise lines and tour operators are combined into one sector. Both share similarities in that they offer multi-day pre-packaged itineraries that combine multiple suppliers and destinations into one offering. Both are also commonly sold through third party distribution channels. The Cruise and Tours sector has relatively fewer public companies.
Ground transportation is our smallest sector. It is primarily made up of car rental companies and intercity bus lines. There were not enough public companies to divide this category into meaningful subsectors but if more companies in the space IPO or otherwise come to light we would look to revisit this classification.
Introducing the Index Divisor
The Skift Travel 200 is maintained via an index divisor. The divisor functions like the shares outstanding for a company. The market value of a company is determined by its share price multiplied by its shares outstanding. For a stock index, which doesn’t have any legal shares issued, market value is determined by index price multiplied by its divisors.
Index Market Value = Index Price * Index Divisor
Stock Indices also face the issue of how to handle additions or removals of the underlying stocks that make up the index. Making a change to the stocks inside the index will change the market value of the index in a dramatic way but we don’t want those changes to affect the index price.
Take the example of Airbnb. The Skift Travel 200 starts in December 2018 but Airbnb only goes public in December 2020. Airbnb IPO’ed with a market value of ~$80B. At the time the total market cap of all other travel stocks was ~$810 billion. If we just added Airbnb without any adjustment then the market value of the travel index would increase to $890 billion. Even though travel stocks were flat that day, if we did nothing to control for adding ABNB, then the index would rise ~10% due to the extra market cap.
We want the index to always reflect the fundamental performance of underlying stocks and to hide the impact of back-end administrative changes. We solve this issue by adjusting the index divisor. The market cap formula can be rewritten as:
Index Price = Market Value / Divisor
And because we know that we want the index price to stay the same when we add or remove any companies, we adjust the divisor to match the change in market value.
(1) Old Index Price = New Index Price
(2) Old Market Value / Old Divisor = Index Price = New Market Value / New Divisor
(3) New Divisor = Old Divisor * New Market Value / Old Market Value
(4) New Divisor = Old Divisor * Change in Market Value
In our example, when we add Airbnb the divisor goes up by 10% to match the 10% raise in market value. This works in reverse too, if a company gets taken private and removed from the index, we would adjust the divisor lower.
Quarterly Rebalancing
We update the Skift Travel 200 four times a year. Each quarter Skift Research decides if there are any new public travel companies that should be added to the index and any that should be removed. Every quarter we will recalculate a new divisor. This divisor captures changes in market value due to company changes as well as changes in market value due to the issuance of new shares or buybacks of shares from existing companies within the index.
We will always rebalance the index at the end of the quarter. But from time to time, we may also add extra divisor adjustments within a quarter to rebalance the index for a major merger, bankruptcy, or stock split.
Divisor-Adjusted Fundamental Data
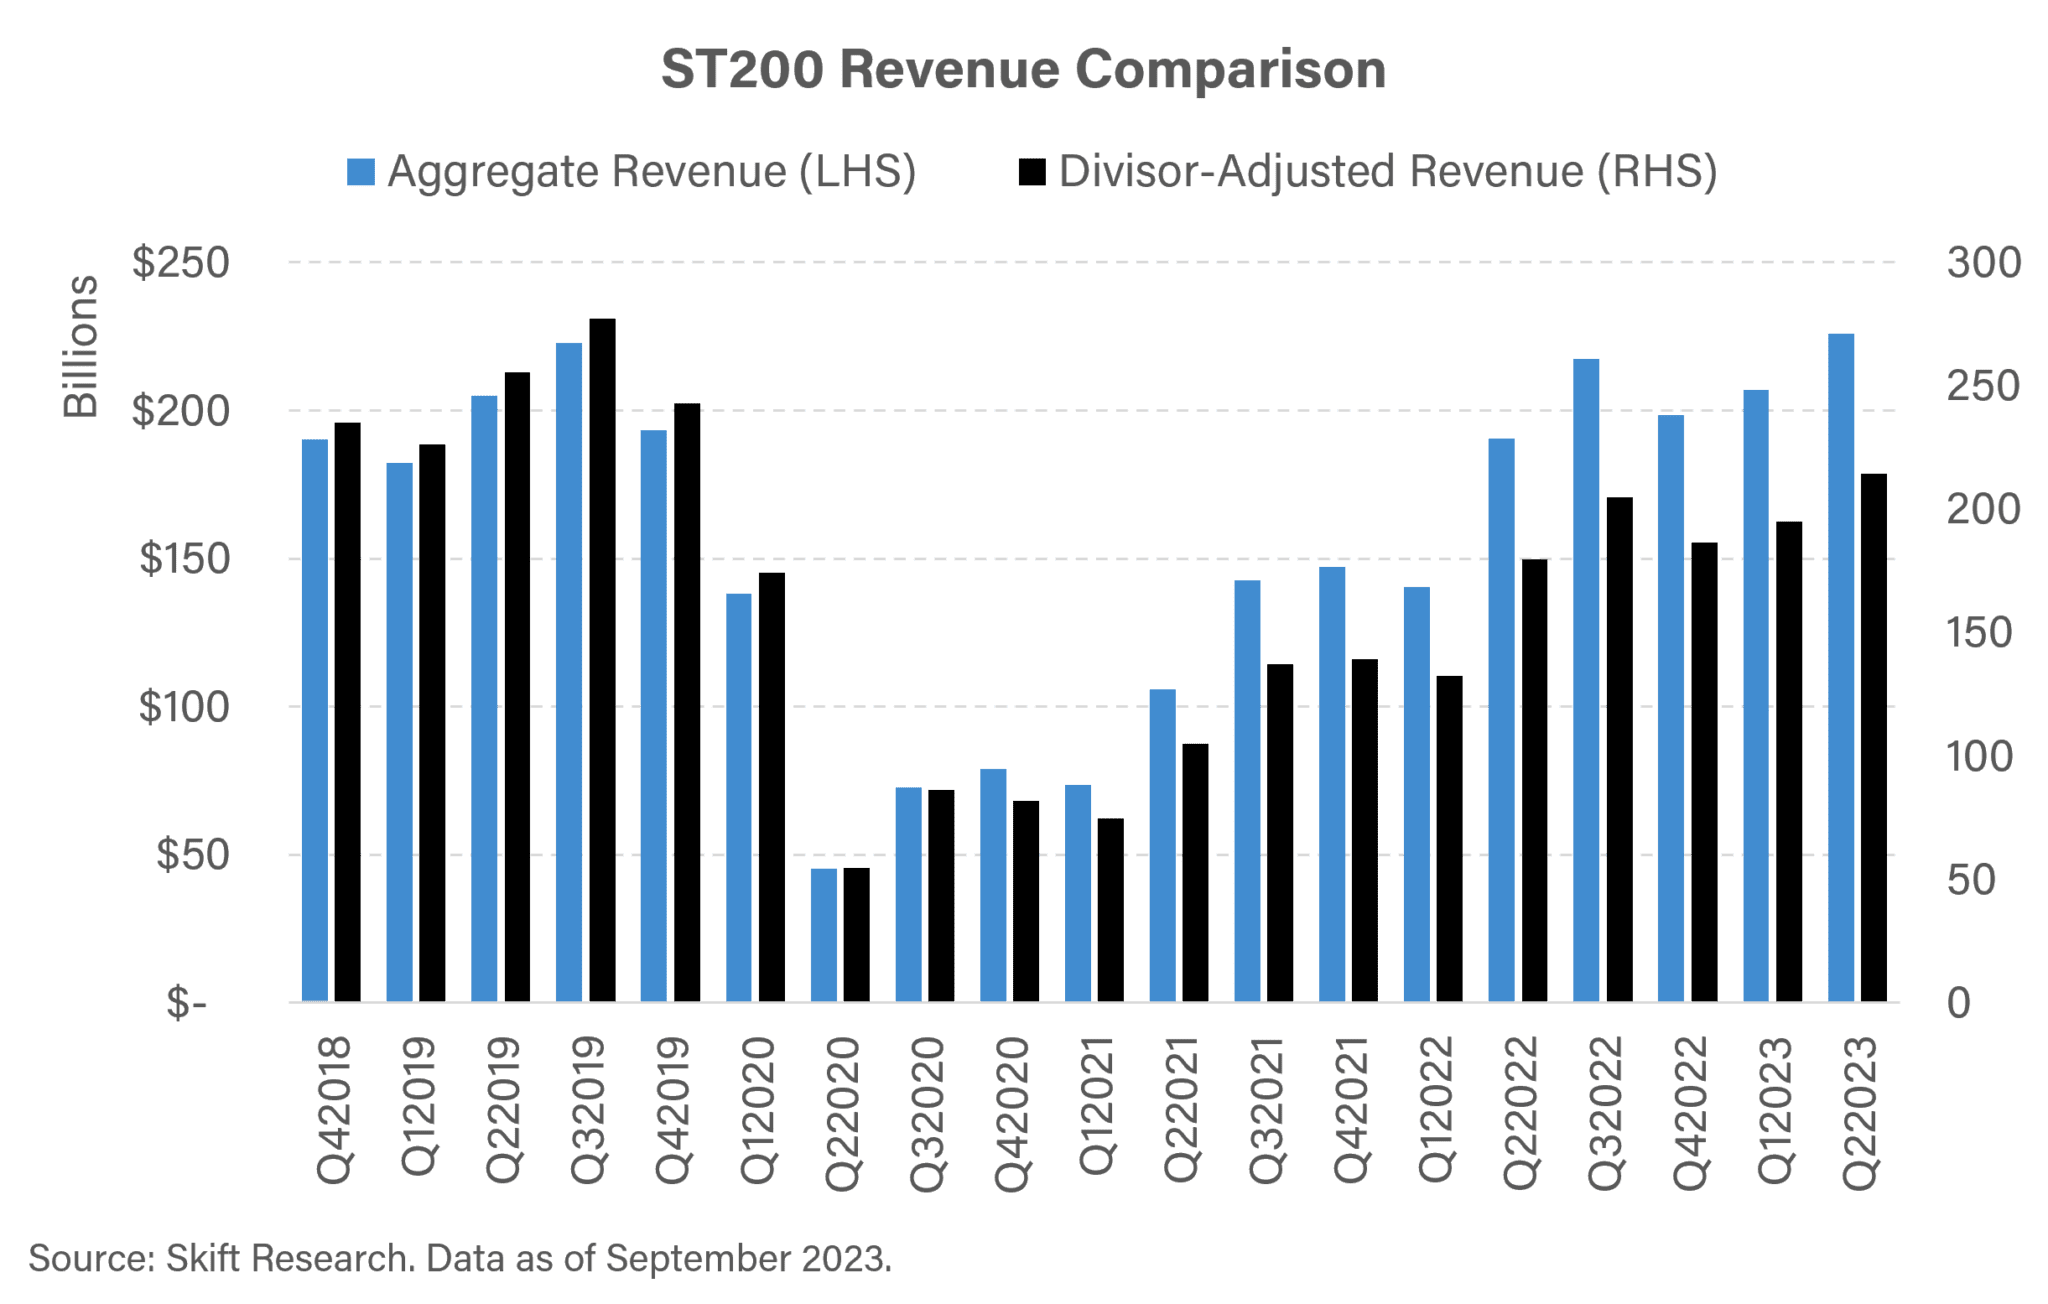
One of the benefits of a travel-specific stock index is that we can aggregate fundamental company data, such as sales and profits, to understand how the industry is performing over time. However, changes to the index composition means we will run into the same issue with time series revenue data as we face with market values.
Just as aggregate market value will be subject to big swings by adding a new company, so too will aggregate revenues. Back to our Airbnb example, if we add that company in December 2020, it will throw off growth rates for revenue in the following quarter. That is because Q1 2021 sales will include Airbnb revenue, but Q1 2020 sales will not. That gives an unfair boost to revenue growth rates when we add a new company to the index in the prior quarter. This would work in reverse if we removed a company.
To adjust for this, just like we do for market value, we use the index divisor as a scalar. We divide aggregate revenue by the index divisor to get divisor-adjusted revenue. This is the equivalent of revenue per share for an individual company.
The drawback of this approach is that divisor-adjusted revenue is not in dollar units which can be confusing especially when we are used to thinking of revenue as a dollar figure. But the benefit is that divisor-adjusted revenue makes for more accurate growth rate comparisons over time.
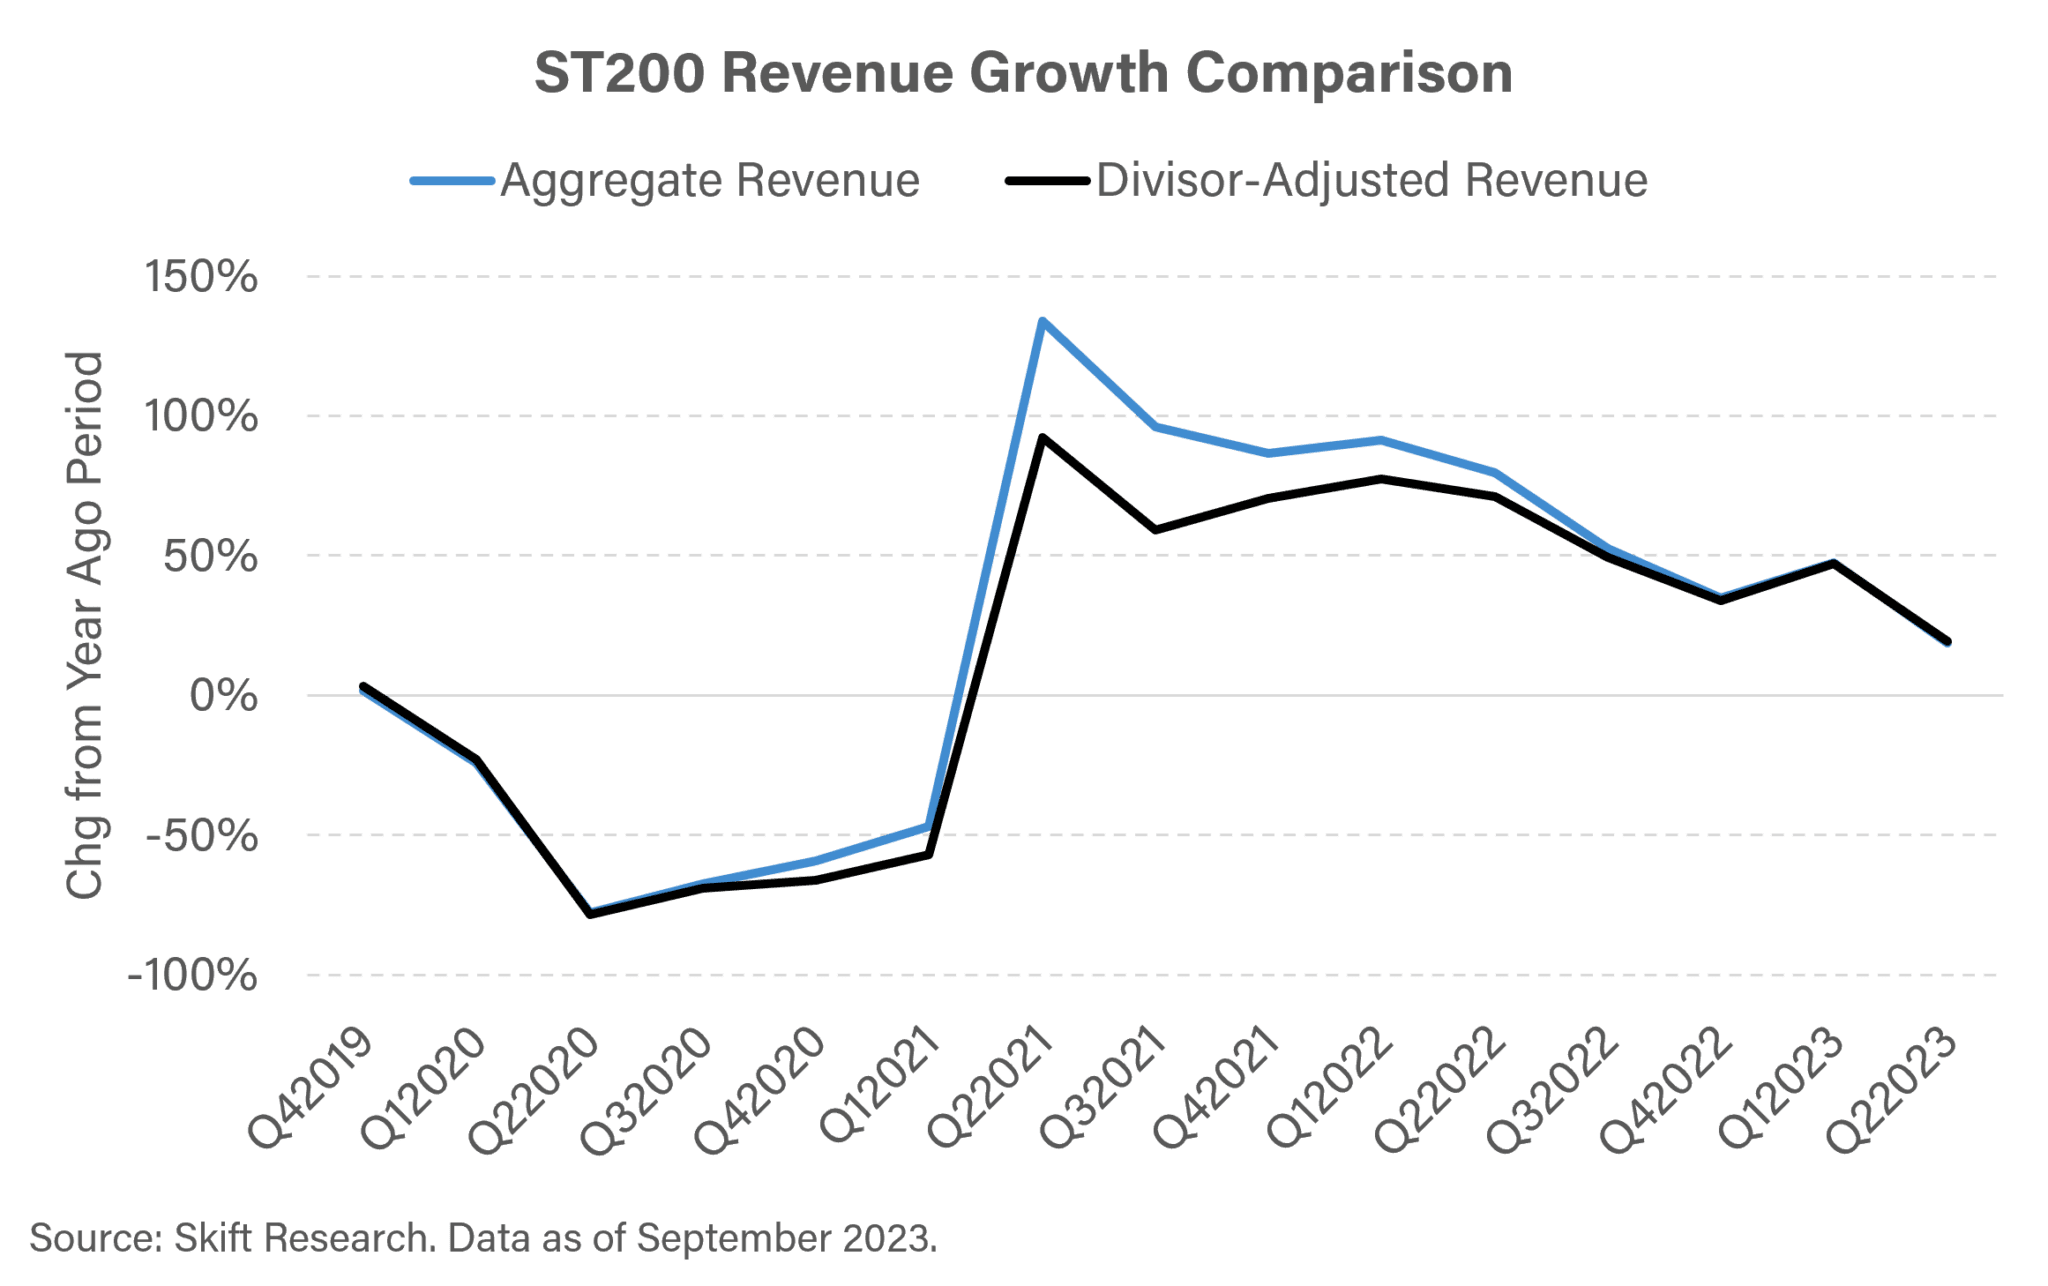
We can see the difference between these two revenue measurements most clearly by looking at year-on-year growth rates. Airbnb is added in December 2020 so Q1 2021 sees a large divisor adjustment. This is also around the time of travel SPACs and IPOs — all adding aggregate market value and revenue which is causing the divisor to be adjusted upwards. Aggregate revenue grew by 134% in Q2 ’21 vs. Q2 ’20. But keep in mind that many of the companies included in that 2021 aggregate revenue figure were not part of the index in 2020, so they are artificially inflating this growth rate. The divisor-adjusted growth rate is 40 points lower at 92%. This is probably a more accurate read on the actual pace of top-line growth for the industry at that time. Still an impressive gain, but more realistic than what the aggregate figures would lead you to believe.
Throughout our reporting on the ST200 we will switch back and forth between these two measurements. For any static comparisons within a single quarter, for instance breaking down revenue by sector or comparing the travel industry with other industries, we will use aggregate revenue in dollars. But when making time series comparisons across quarters, we will use divisor-adjusted revenue.
ST200 Company Constituents
Below is a table with all the current constituents that make up the Skift Travel 200 and the corresponding sector and sub-sector we have assigned to that business.
| Sectors | Company Name | Ticker | Market Cap ($M USD) |
|---|---|---|---|
| Accommodations | $374,387 | ||
| Global Hotel Brands | $157,408 | ||
| Marriott International, Inc. | NasdaqGS:MAR | $60,590 | |
| Hilton Worldwide Holdings Inc. | NYSE:HLT | $40,380 | |
| InterContinental Hotels Group PLC | LSE:IHG | $12,894 | |
| Hyatt Hotels Corporation | NYSE:H | $11,165 | |
| Accor SA | ENXTPA:AC | $9,544 | |
| Choice Hotels International, Inc. | NYSE:CHH | $6,274 | |
| Wyndham Hotels & Resorts, Inc. | NYSE:WH | $6,273 | |
| Genting Berhad | KLSE:GENTING | $3,453 | |
| Mandarin Oriental International Limited | SGX:M04 | $2,098 | |
| NH Hotel Group, S.A. | BME:NHH | $1,936 | |
| Meliá Hotels International, S.A. | BME:MEL | $1,467 | |
| The Hongkong and Shanghai Hotels, Limited | SEHK:45 | $1,334 | |
| Regional Hotel Brands | $47,885 | ||
| H World Group Limited | NasdaqGS:HTHT | $12,948 | |
| Whitbread plc | LSE:WTB | $8,808 | |
| The Indian Hotels Company Limited | NSEI:INDHOTEL | $7,103 | |
| Shanghai Jin Jiang International Hotels Co., Ltd. | SHSE:900934 | $5,277 | |
| Hotel Shilla Co.,Ltd | KOSE:A008770 | $2,552 | |
| Shangri-La Asia Limited | SEHK:69 | $2,421 | |
| Central Plaza Hotel Public Company Limited | SET:CENTEL | $1,824 | |
| EIH Limited | NSEI:EIHOTEL | $1,753 | |
| Lemon Tree Hotels Limited | NSEI:LEMONTREE | $1,113 | |
| Huatian Hotel Group Co.,Ltd. | SZSE:000428 | $783 | |
| Grupo Posadas, S.A.B. de C.V. | BMV:POSADAS A | $722 | |
| Scandic Hotels Group AB (publ) | OM:SHOT | $663 | |
| Jinling Hotel Corporation, Ltd. | SHSE:601007 | $497 | |
| GreenTree Hospitality Group Ltd. | NYSE:GHG | $431 | |
| Stamford Land Corporation Ltd | SGX:H07 | $416 | |
| Regal Hotels International Holdings Limited | SEHK:78 | $317 | |
| Banyan Tree Holdings Limited | SGX:B58 | $255 | |
| Hotel Management and Operations | $20,083 | ||
| Minor International Public Company Limited | SET:MINT | $4,975 | |
| BTG Hotels (Group) Co., Ltd. | SHSE:600258 | $2,830 | |
| Pandox AB (publ) | OM:PNDX B | $2,004 | |
| Hotel Properties Limited | SGX:H15 | $1,446 | |
| Target Hospitality Corp. | NasdaqCM:TH | $1,417 | |
| Chalet Hotels Limited | NSEI:CHALET | $1,387 | |
| Playa Hotels & Resorts N.V. | NasdaqGS:PLYA | $1,102 | |
| RLH Properties, S.A.B. de C.V. | BMV:RLH A | $1,045 | |
| Miramar Hotel and Investment Company, Limited | SEHK:71 | $946 | |
| Formosa International Hotels Corporation | TWSE:2707 | $867 | |
| PPHE Hotel Group Limited | LSE:PPH | $567 | |
| Hotel Grand Central Limited | SGX:H18 | $467 | |
| Bonvests Holdings Limited | SGX:B28 | $295 | |
| S Hotels and Resorts Public Company Limited | SET:SHR | $280 | |
| Grupo Hotelero Santa Fe, S.A.B. de C.V. | BMV:HOTEL * | $170 | |
| Grupe, S.A.B. de C.V. | BMV:CIDMEGA * | $145 | |
| Paliburg Holdings Limited | SEHK:617 | $141 | |
| Hotel REITs | $44,099 | ||
| Host Hotels & Resorts, Inc. | NasdaqGS:HST | $11,813 | |
| Ryman Hospitality Properties, Inc. | NYSE:RHP | $5,085 | |
| Apple Hospitality REIT, Inc. | NYSE:APLE | $3,704 | |
| Park Hotels & Resorts Inc. | NYSE:PK | $2,828 | |
| Covivio Hotels | ENXTPA:COVH | $2,798 | |
| Ascott Residence Trust | SGX:HMN | $2,717 | |
| Sunstone Hotel Investors, Inc. | NYSE:SHO | $1,931 | |
| Pebblebrook Hotel Trust | NYSE:PEB | $1,773 | |
| DiamondRock Hospitality Company | NYSE:DRH | $1,729 | |
| RLJ Lodging Trust | NYSE:RLJ | $1,564 | |
| Service Properties Trust | NasdaqGS:SVC | $1,322 | |
| Xenia Hotels & Resorts, Inc. | NYSE:XHR | $1,319 | |
| CDL Hospitality Trusts | SGX:J85 | $968 | |
| Far East Hospitality Trust | SGX:Q5T | $917 | |
| Frasers Hospitality Trust | SGX:ACV | $714 | |
| Summit Hotel Properties, Inc. | NYSE:INN | $620 | |
| FibraHotel | BMV:FIHO 12 | $497 | |
| Chatham Lodging Trust | NYSE:CLDT | $487 | |
| Regal Real Estate Investment Trust | SEHK:1881 | $320 | |
| Braemar Hotels & Resorts Inc. | NYSE:BHR | $187 | |
| ARA US Hospitality Trust | SGX:XZL | $177 | |
| Century City International Holdings Limited | SEHK:355 | $101 | |
| Ashford Hospitality Trust, Inc. | NYSE:AHT | $99 | |
| Sotherly Hotels Inc. | NasdaqGM:SOHO | $34 | |
| Alternative Accommodations | $93,088 | ||
| Airbnb, Inc. | NasdaqGS:ABNB | $91,086 | |
| Soho House & Co | NYSE:SHCO | $1,396 | |
| HomeToGo SE | XTRA:HTG | $388 | |
| Vacasa, Inc. | NasdaqGS:VCSA | $100 | |
| Sonder Holdings Inc. | NasdaqGS:SOND | $75 | |
| Inspirato Incorporated | NasdaqGM:ISPO | $43 | |
| Time Shares | $11,825 | ||
| Hilton Grand Vacations Inc. | NYSE:HGV | $4,629 | |
| Marriott Vacations Worldwide Corporation | NYSE:VAC | $3,744 | |
| Travel + Leisure Co. | NYSE:TNL | $2,851 | |
| Bluegreen Vacations Holding Corporation | NYSE:BVH | $601 | |
| Airlines | $344,323 | ||
| Network Carriers | $238,616 | ||
| Singapore Airlines Limited | SGX:C6L | $25,909 | |
| Delta Air Lines, Inc. | NYSE:DAL | $25,548 | |
| Air China Limited | SEHK:753 | $16,659 | |
| United Airlines Holdings, Inc. | NasdaqGS:UAL | $14,989 | |
| China Southern Airlines Company Limited | SEHK:1055 | $14,142 | |
| China Eastern Airlines Corporation Limited | SHSE:600115 | $12,505 | |
| Türk Hava Yollari Anonim Ortakligi | OTCPK:TKHV.Y | $11,614 | |
| ANA Holdings Inc. | OTCPK:ALNP.F | $10,354 | |
| Deutsche Lufthansa AG | XTRA:LHA | $10,314 | |
| International Consolidated Airlines Group S.A. | LSE:IAG | $9,370 | |
| Japan Airlines Co., Ltd. | OTCPK:JPNR.F | $8,871 | |
| Hainan Airlines Holding Co., Ltd. | SHSE:900945 | $8,848 | |
| American Airlines Group Inc. | NasdaqGS:AAL | $8,696 | |
| Cathay Pacific Airways Limited | SEHK:293 | $6,710 | |
| Korean Air Lines Co., Ltd. | KOSE:A003490 | $6,282 | |
| Qantas Airways Limited | OTCPK:QUBS.F | $6,256 | |
| LATAM Airlines Group S.A. | SNSE:LTM | $5,810 | |
| Air Canada | TSX:AC | $5,391 | |
| EVA Airways Corp. | TWSE:2618 | $5,133 | |
| Alaska Air Group, Inc. | NYSE:ALK | $5,022 | |
| Juneyao Airlines Co., Ltd | SHSE:603885 | $4,353 | |
| China Airlines, Ltd. | TWSE:2610 | $4,219 | |
| Copa Holdings, S.A. | NYSE:CPA | $3,696 | |
| Air France-KLM SA | ENXTPA:AF | $3,471 | |
| Vietnam Airlines JSC | HOSE:HVN | $1,164 | |
| Bangkok Airways Public Company Limited | SET:BA | $970 | |
| Finnair Oyj | HLSE:FIA1S | $811 | |
| Asiana Airlines, Inc. | KOSE:A020560 | $609 | |
| Hawaiian Holdings, Inc. | NasdaqGS:HA | $410 | |
| El Al Israel Airlines Ltd. | TASE:ELAL | $213 | |
| SAS AB (publ) | OM:SAS | $200 | |
| Jet Airways (India) Limited | NSEI:JETAIRWAYS | $76 | |
| Low Cost Carriers | $98,661 | ||
| Ryanair Holdings plc | NasdaqGS:RYAA.Y | $20,216 | |
| Southwest Airlines Co. | NYSE:LUV | $17,684 | |
| InterGlobe Aviation Limited | NSEI:INDIGO | $11,142 | |
| Gol Linhas Aéreas Inteligentes S.A. | NYSE:GOL | $8,403 | |
| Spring Airlines Co., Ltd. | SHSE:601021 | $7,518 | |
| easyJet plc | LSE:EZJ | $4,174 | |
| Wizz Air Holdings Plc | LSE:WIZZ | $2,640 | |
| VietJet Aviation Joint Stock Company | HOSE:VJC | $2,206 | |
| Spirit Airlines, Inc. | NYSE:SAVE | $1,797 | |
| JetBlue Airways Corporation | NasdaqGS:JBLU | $1,656 | |
| Allegiant Travel Company | NasdaqGS:ALGT | $1,525 | |
| China Express Airlines Co.,LTD | SZSE:002928 | $1,346 | |
| Frontier Group Holdings, Inc. | NasdaqGS:ULCC | $1,223 | |
| Controladora Vuela Compañía de Aviación, S.A.B. de C.V. | BMV:VOLAR A | $1,055 | |
| Azul S.A. | NYSE:AZUL | $967 | |
| Sun Country Airlines Holdings, Inc. | NasdaqGS:SNCY | $815 | |
| Norwegian Air Shuttle ASA | OB:NAS | $806 | |
| Jeju Air Co., Ltd. | KOSE:A089590 | $668 | |
| Jin Air Co., Ltd. | KOSE:A272450 | $485 | |
| SpiceJet Limited | BSE:500285 | $313 | |
| Air Busan Co., Ltd. | KOSE:A298690 | $254 | |
| Norse Atlantic ASA | OB:NORSE | $148 | |
| Copa Holdings, S.A. | NYSE:CPA | $3,696 | |
| Air France-KLM SA | ENXTPA:AF | $3,471 | |
| Vietnam Airlines JSC | HOSE:HVN | $1,164 | |
| Bangkok Airways Public Company Limited | SET:BA | $970 | |
| Finnair Oyj | HLSE:FIA1S | $811 | |
| Asiana Airlines, Inc. | KOSE:A020560 | $609 | |
| Hawaiian Holdings, Inc. | NasdaqGS:HA | $410 | |
| El Al Israel Airlines Ltd. | TASE:ELAL | $213 | |
| SAS AB (publ) | OM:SAS | $200 | |
| Jet Airways (India) Limited | NSEI:JETAIRWAYS | $76 | |
| Other Airline Related | $7,047 | ||
| Joby Aviation, Inc. | NYSE:JOBY | $4,537 | |
| SkyWest, Inc. | NasdaqGS:SKYW | $1,803 | |
| Chorus Aviation Inc. | TSX:CHR | $360 | |
| Blade Air Mobility, Inc. | NasdaqCM:BLDE | $216 | |
| Wheels Up Experience Inc. | NYSE:UP | $80 | |
| Mesa Air Group, Inc. | NasdaqGS:MESA | $50 | |
| Travel Tech | $208,184 | ||
| Online Travel | $167,073 | ||
| Booking Holdings Inc. | NasdaqGS:BKNG | $112,793 | |
| Trip.com Group Limited | NasdaqGS:TCOM | $23,203 | |
| Expedia Group, Inc. | NasdaqGS:EXPE | $15,327 | |
| Tongcheng Travel Holdings Limited | SEHK:780 | $5,063 | |
| MakeMyTrip Limited | NasdaqGS:MMYT | $4,089 | |
| Tripadvisor, Inc. | NasdaqGS:TRIP | $2,205 | |
| Webjet Limited | OTCPK:WEBJ.F | $1,680 | |
| eDreams ODIGEO S.A. | BME:EDR | $852 | |
| Despegar.com, Corp. | NYSE:DESP | $498 | |
| trivago N.V. | NasdaqGS:TRVG | $383 | |
| lastminute.com N.V. | SWX:LMN | $295 | |
| On the Beach Group plc | LSE:OTB | $246 | |
| Hostelworld Group plc | LSE:HSW | $193 | |
| Yatra Online, Inc. | NasdaqCM:YTRA | $157 | |
| Travelzoo | NASDAQGS:TZOO | $89 | |
| B2B Tech | $41,110 | ||
| Amadeus IT Group, S.A. | BME:AMS | $30,128 | |
| Beijing Shiji Information Technology Co., Ltd. | SZSE:002153 | $4,385 | |
| Global Business Travel Group, Inc. | NYSE:GBTG | $2,693 | |
| Corporate Travel Management Limited | OTCPK:CTML.F | $1,626 | |
| Sabre Corporation | NasdaqGS:SABR | $1,535 | |
| RateGain Travel Technologies Limited | NSEI:RATEGAIN | $743 | |
| Cruise and Tours | $68,230 | ||
| Cruise Lines | $51,750 | ||
| Royal Caribbean Cruises Ltd. | NYSE:RCL | $24,956 | |
| Carnival Corporation & plc | NYSE:CCL | $19,042 | |
| Norwegian Cruise Line Holdings Ltd. | NYSE:NCLH | $7,330 | |
| Lindblad Expeditions Holdings, Inc. | NasdaqCM:LIND | $421 | |
| Tour Operators | $16,480 | ||
| TUI AG | XTRA:TUI1 | $3,028 | |
| Jet2 plc | AIM:JET2 | $2,955 | |
| Flight Centre Travel Group Limited | OTCPK:FGET.F | $2,813 | |
| China Travel International Investment Hong Kong Limited | SEHK:308 | $1,089 | |
| Huangshan Tourism Development Co.,Ltd. | SHSE:600054 | $1,083 | |
| Guangzhou Lingnan Group Holdings Company Limited | SZSE:000524 | $914 | |
| Yunnan Tourism Co., Ltd. | SZSE:002059 | $895 | |
| Lotte Tour Development Co., Ltd. | KOSE:A032350 | $845 | |
| Emei Shan Tourism Co.,Ltd | SZSE:000888 | $802 | |
| Xi’an Qujiang Cultural Tourism Co., Ltd. | SHSE:600706 | $701 | |
| Hanatour Service Inc. | KOSE:A039130 | $569 | |
| Voyageurs du Monde SA | ENXTPA:ALVDM | $529 | |
| Rainbow Tours S.A. | WSE:RBW | $136 | |
| Transat A.T. Inc. | TSX:TRZ | $121 | |
| Ground Transportation | $36,523 | ||
| Localiza Rent a Car S.A. | BOVESPA:RENT3 | $13,074 | |
| Avis Budget Group, Inc. | NasdaqGS:CAR | $7,691 | |
| Hertz Global Holdings, Inc. | NasdaqGS:HTZ | $5,017 | |
| ComfortDelGro Corporation Limited | SGX:C52 | $2,034 | |
| SIMPAR S.A. | BOVESPA:SIMH3 | $1,644 | |
| FirstGroup plc | LSE:FGP | $1,301 | |
| Movida Participações S.A. | BOVESPA:MOVI3 | $894 | |
| LOTTE rental co.,ltd. | KOSE:A089860 | $757 | |
| Theeb Rent A Car Company | SASE:4261 | $742 | |
| Mobico Group Plc | LSE:MCG | $665 | |
| Transport International Holdings Limited | SEHK:62 | $617 | |
| Saudi Public Transport Company | SASE:4040 | $568 | |
| Hubei Three Gorges Tourism Group Co., Ltd. | SZSE:002627 | $558 | |
| SK Rent A Car Co., Ltd | KOSE:A068400 | $411 | |
| PT Blue Bird Tbk | IDX:BIRD | $324 | |
| Jiangxi Changyun Co., Ltd. | SHSE:600561 | $227 |
Source: Skift Research. Data as of 9/18/2023.