
Report Overview
With this report Skift Research completes its effort to size the global accommodation industry by adding the estimates of the African, Middle Eastern and American (excl. U.S.) accommodation industry to the U.S., Europe and Asia Pacific estimates published earlier this year.
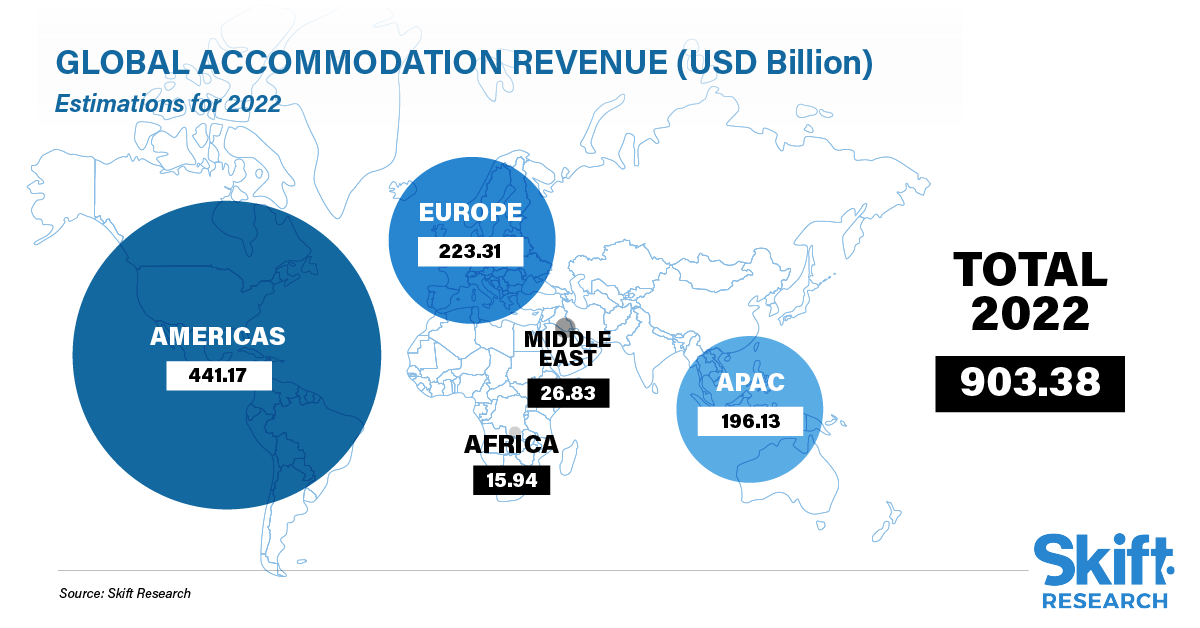
Skift Research estimates that the market size, measured by revenue, of the global accommodation sector is projected to reach $903 billion by 2022. At a regional level, the Americas is expected to contribute around 49%, about half of the total sector value, followed by Europe (25%), APAC (22%), Middle East (3%) and Africa (2%) in 2022.
The fastest growing segment of accommodations globally has been short-term rentals. The sector is estimated to have grown at a compounded growth rate (CAGR) of 10% between 2018-2022 while the hotels sector shows a negative CAGR (-1%) for the same time period. However, STRs still represent a very small section of the accommodation industry. As per our estimates, the share of STRs in the accommodation industry has increased from 10% in 2018 to 14% in 2022.
In addition to these topline estimates, this report includes an analysis of, and estimates for, key hospitality performance indicators such as revenue per available room, average daily rate, and occupancy rates for hotels in the top countries of Africa, the Middle East and the Americas. Similar indicators for the U.S., Europe, and APAC can be found in the respective reports published earlier.
What You'll Learn From This Report
- Global accommodation sector market size estimates, by region, by hotel sector and short-term rental sector, 2018–2022E
- Americas, Middle East and Africa hotel sector revenues of key countries, 2008–2022E
- Americas, Middle East and Africa hotels size and scale of companies of key countries, 2008–2019
- Americas, Middle East and Africa hotels key performance indicators of key countries, 2008–2019
Executive Summary
Skift Research estimates that the market size, measured by revenue, of the global accommodation sector, is projected to reach $903 billion by 2022. 2022 revenue is approximately 95% of sector revenue in 2019, indicating that a global recovery is imminent by 2023. At a regional level, the Americas is expected to contribute around 49%, about half of the total sector value, followed by Europe (25%), APAC (22%), Middle East (3%) and Africa (2%) in 2022.
The fastest growing segment of accommodations globally has been short-term rentals. The sector is projected to grow at a compounded growth rate (CAGR) of 10% between 2018-2022 while the hotels sector would not have fully recovered from the impact of the pandemic in 2022 and shows a negative CAGR (-1%) for the same time period. However, STRs still represent a very small section of the accommodation industry. As per our estimates, the share of STRs in the accommodation industry has increased from 10% in 2018 to 14% in 2022.
In our market sizing reports published earlier this year, we presented a country level analysis of the hotel sector in Europe and APAC. We also published a separate report analysing the hotel sector in the U.S. In this report we cover the hotel sector of key countries in the remaining regions, namely Africa, Middle East and the rest of the Americas.
In the Americas, Mexico is the second largest hotel market by revenue in the region after the U.S. We estimate that it will generate $31.43 billion in revenue in 2022. Canada on the other hand is expected to generate $15.40 billion in revenue in 2022. Argentina, Colombia and Peru are projected to generate $5.37 billion, $2.81 billion and $2.80 billion in revenue in 2022, respectively.
In the Middle East, we estimate that the hotel sector in Saudi Arabia will generate sales of $14.78 billion in 2022 while hotel sectors in the United Arab Emirates (UAE) and Qatar are expected to generate sales of $8.42 billion and $1.37 billion in 2022.
In Africa, Egypt is the largest hotel market in terms of revenue, expected to generate sales of $3.28 billion in 2022. Hotel sector revenues in Morocco and South Africa are expected to be $2.7 billion and $2.3 billion in 2022, respectively. The accommodation sector in Nigeria and Kenya is relatively small with their projected revenue to be $0.9 billion and $0.8 billion respectively in 2022.
Along with the revenue and forecasts we also discuss the size and scale and key performance indicators of the hotel industry in each of the key countries in the Americas (excl. U.S.), Middle East, and Africa in this report.
Global Accommodation Estimates
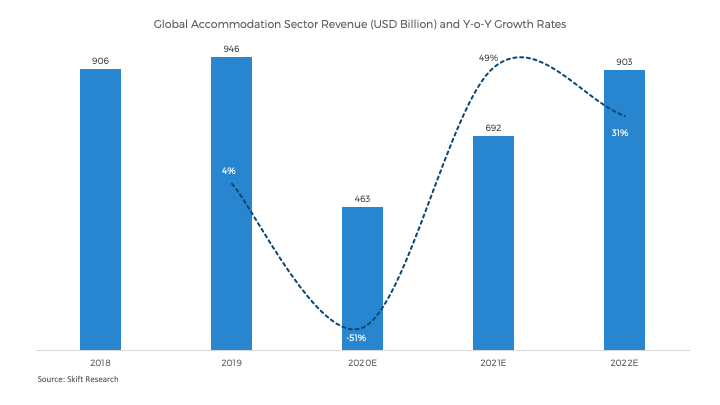
Skift Research estimates that the market size, measured by revenue, of the global accommodation sector is projected to reach $903.38 billion by 2022. 2022 revenue is approximately 95% of the sector revenue in 2019, indicating that a global recovery is imminent by 2023.
Global Accommodation Estimates – By Region
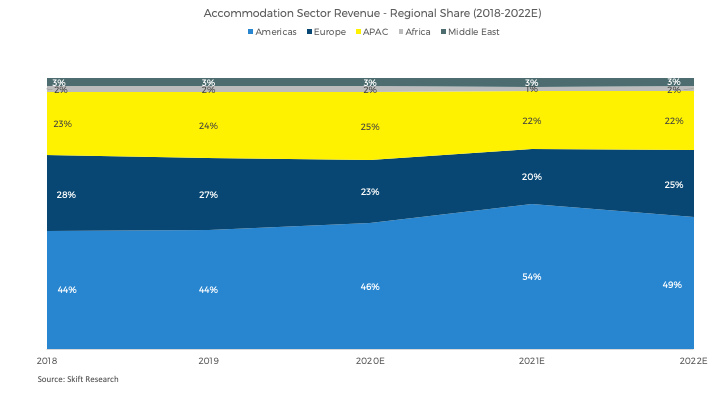
At a regional level, the Americas is expected to contribute around 49%, about half of the total sector value, followed by Europe (25%), APAC (22%), Middle East (3%) and Africa (2%) in 2022.
Looking at the regional share over the previous years, it is clear that the Americas (incl. U.S.) has held and continues to hold the most dominant position in the accommodation sector, followed by Europe, APAC, the Middle East, and Africa with the exception of 2020 and 2021 where APAC superseded Europe due to a relatively slower recovery of the sector from the pandemic in the latter region.
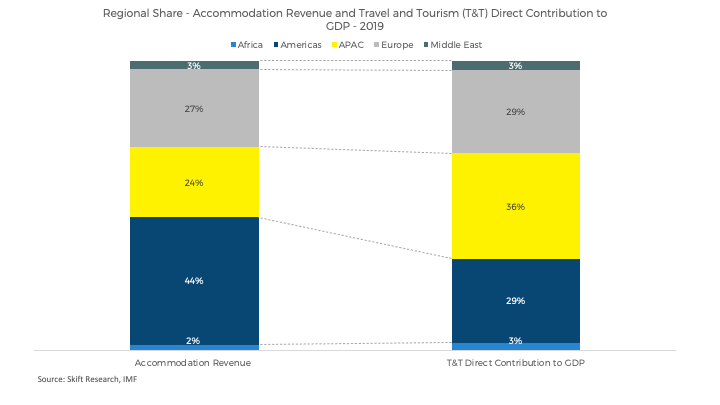
Interestingly, the regional share of accommodation sector revenues are not in line with the regional share of travel and tourism’s direct contribution to GDP, as per data from the International Monetary Fund.
While the Americas is the biggest contributor of accommodation sector revenue globally, travel and tourism’s direct contribution to GDP of APAC is the highest globally. While accommodation revenues make a significant contribution to the travel and tourism GDP in the Americas (40% on an average), it contributes much less to APAC’s travel and tourism GDP (15% on average).
The fact that the Americas is the biggest market for luxury hotels coupled with a larger spending power of the region’s population and a very large domestic travel market explains the mismatch in the regional breakdown of the global travel and tourism GDP and accommodation sector revenue.
Global Accommodation Estimates – By Sub-Sector
The short-term rental business has been encroaching on the hotel industry for over a decade now, and nobody can afford to ignore the sector for its increasing market share and the changing consumer expectations that it has helped to usher in.
The prominence of short-term rentals increased even more during the pandemic as it was the exact kind of accommodation model consumers preferred. Many travelers shied away from hotels during the pandemic and instead escaped to short-term rentals, where they could hunker down, avoid crowds, prepare their own meals and essentially use it as a quarantine bubble.
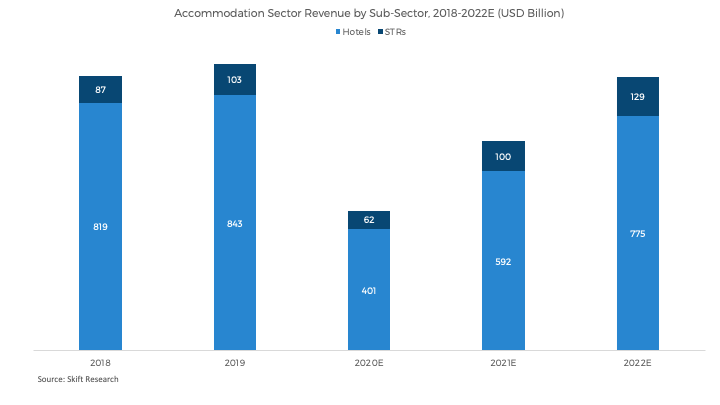
While the year-on-year growth of STRs from 2018 to 2019 was 19%, hotels grew at 3% during the same period. The pandemic had a relatively mild impact on STRs as compared to the hotels. Data shows that, while revenue for hotels decreased by 52%, revenue for STRs decreased by 40% in 2020. The percentage share of STRs is expected to increase from 10% in 2018 to 14% in 2022 at a global level.
When we compare 2022 estimates with 2019 revenue, revenue of hotels in 2022 is expected to be 8% lower than 2019 revenue while revenue of STRs is expected to increase by 24% as compared to 2019 levels. In terms of actual revenue, revenue of hotels is projected to reach $774.82 billion while STRs are projected to reach $128.57 billion by 2022.
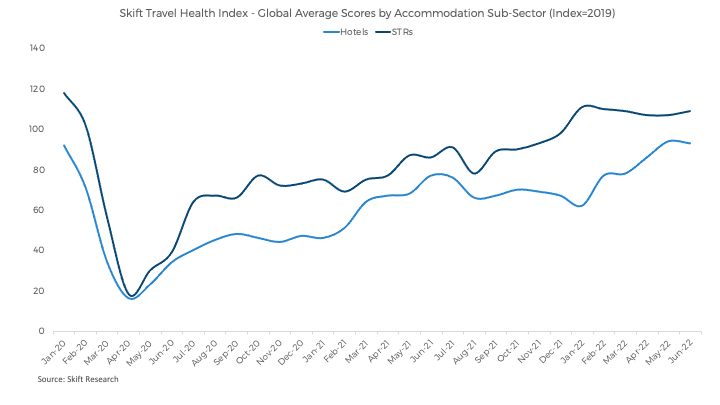
Skift Research’s Travel Health Index confirmed this difference in the pace of recovery of hotels and STRs as presented in the chart below.
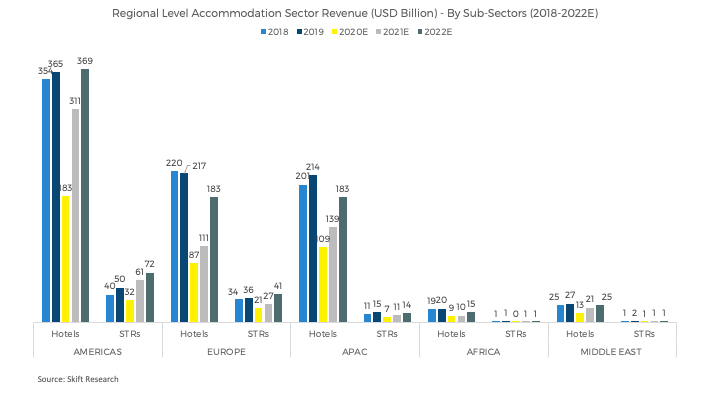
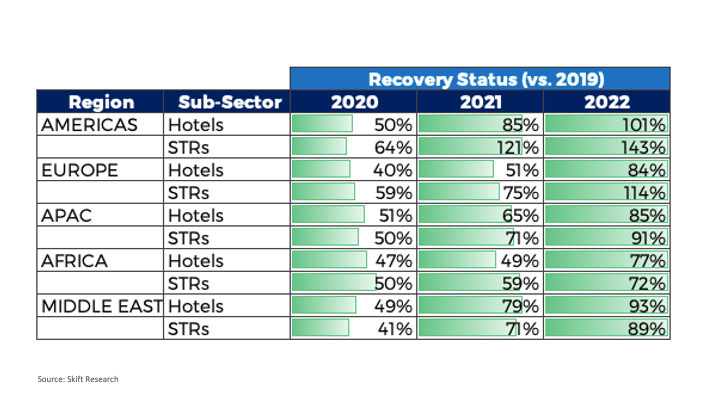
When comparing the decline of the revenue of the two sub-sectors in 2020, revenue of STRs in the Americas and Europe was less severely impacted by the pandemic as compared to the hotels. In Africa, hotels and STRs recovered at a similar pace. In APAC and the Middle East, STRs were more severely impacted by the pandemic as compared to hotels. The common feature of the accommodation sector in APAC, Middle East and Africa is the nascency of STRs. While STRs were a comparatively mature form of accommodation in the western world, remaining regions were still adapting to this new class of accommodation before the pandemic hit barring a few countries like Japan, China and Australia where STRs markets share has grown considerably.
In 2021, STRs recovered faster in all regions except the Middle East where hotels still ruled the accommodation sector.
In 2022, STRs recovered faster than hotels in the Americas, Europe, and APAC regions. The sector’s revenue has already surpassed the 2019 levels in Americas and Europe. In Africa, hotels recovered faster than STRs in 2022 while in the Middle East hotels continue to recover faster in 2022, like in 2020 and 2021.
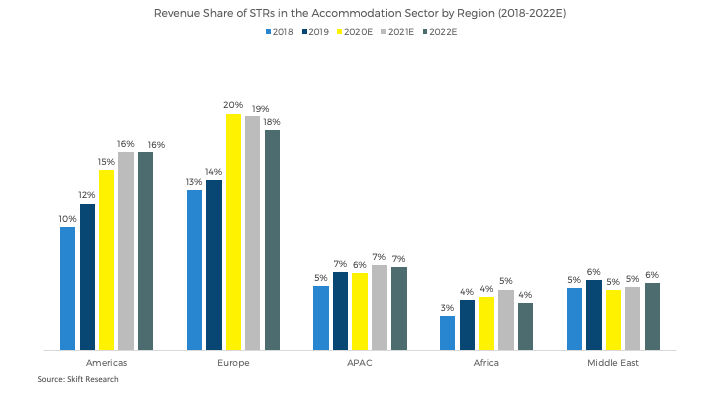
As per our estimates, revenue share of STRs in the overall accommodation sector increased from 12% to 16% between 2019 and 2021. For the Americas, the revenue share of STRs is expected to remain stable at 16% in 2022. For Europe, the revenue share of STRs increased from 14% to 19% from 2019 to 2021, however, it is expected to decrease to 18% in 2022. For APAC, Middle East and Africa revenue share of STRs increased in 2021 as compared to 2019, but is expected to be back to 2019 levels in 2022.
The situation with respect to STRs’ market share remains fluid, as it will take some time for the pandemic induced consumer behavior to reset in the post-pandemic world. However, STRs have become a more popular concept and have graduated from being an alternative accommodation option to a core accommodation option.
Hotel Sector Market Analysis – The Americas (excl. U.S.), the Middle East, and Africa
In our market sizing reports published earlier this year, we presented a country-level analysis of the hotel sector in Europe and APAC. We also published a separate report analysing the hotel sector in the U.S. In this report we add coverage of key countries in the remaining regions, i.e. Africa, Middle East and Americas (excl. U.S.). Key hotel performance indicators in our analysis include revenue, the size and scale of companies, occupancy rates, Revenue per Available Room (RevPAR) and Average Daily Rates (ADR).
Americas (excl. U.S.)
Revenue and Forecasts
North America
Canada is expected to generate $15.40 billion in revenue in 2022. The hotel industry in Canada is not expected to reach 2019 revenue levels in 2022. Revenue grew at an average rate of 6% year-over-year from 2008 till 2019 before it fell down by 58% due to the pandemic. 2021 can be considered pretty much a lost year for the Canadian hotel industry.
The first part of 2021 was hampered by lockdowns and restrictions, the Canada-United States land border did not open to American travelers until August, and international travel restrictions were still partially lifted. As reported in a Skift article, the slow rebound is continuing for Canada’s tourism businesses in 2022, because of the devastating impact of the Omicron variant. Reinstated border restrictions towards the end of 2021 had a knock-on effect on late winter and spring bookings, leading to cancellations from international visitors as well as event planners, and a dramatic drop in revenue.
Amongst the countries analyzed, Mexico is the second largest hotel market by revenue in the region after the U.S. We estimate that it will generate $31.43 billion in revenue in 2022.
Mexico, on the other hand, was the first country to reach pre-2020 travel levels in June 2021. As one of the first countries to relax foreign entry rules, it became both a final destination and also a transit destination for travelers who wanted to go to the United States but needed to be quarantined in a nearby destination. This fact and other factors – like borders opening early and high vaccination rates – made Mexico the first country to exceed the levels of accommodation revenue observed before the pandemic.
| Hotel Revenue (USD Billion) | 2008 | 2009 | 2010 | 2011 | 2012 | 2013 | 2014 | 2015 | 2016 | 2017 | 2018 | 2019 | 2020e | 2021e | 2022e |
|---|---|---|---|---|---|---|---|---|---|---|---|---|---|---|---|
| Canada | 9.52 | 9.60 | 11.43 | 12.85 | 13.73 | 13.85 | 13.54 | 12.01 | 12.45 | 14.77 | 16.11 | 16.95 | 7.09 | 9.12 | 15.40 |
| Mexico | 11.78 | 8.05 | 12.22 | 14.51 | 16.67 | 18.57 | 22.13 | 26.35 | 28.18 | 28.43 | 27.71 | 26.73 | 14.59 | 28.08 | 31.43 |
Source: Skift Research, Historical data drawn from Statistics Canada, UNWTO, HVS
South America
Argentina, Colombia and Peru are projected to generate $5.37 billion, $2.81 billion and $2.80 billion in revenue in 2022. It must be noted that these three countries show a declining trend in revenue because of their respective local currency depreciation against USD. When converted to their local currency, the revenue shows an increasing trend except for the years 2020 and 2021 when the pandemic severely hit the accommodation sector in these countries.
Of the South American countries, hotel revenue in Argentina is expected to reach ~99% of the pre-pandemic level in 2022 while the sector is far from a full recovery in Peru and Colombia. The recovery timeline for Argentina can be validated by the fact that hotel chains are expanding in Argentina despite the pandemic. As per an article by JLL, chains like Marriott, Accor, Hilton, and Wyndham estimated that from October 2021, the sector began to reactivate. However, a recovery to levels similar to those of 2019 will likely come between the end of 2022 and mid-2023.
| Hotel Revenue (USD Billion) | 2008 | 2009 | 2010 | 2011 | 2012 | 2013 | 2014 | 2015 | 2016 | 2017 | 2018 | 2019 | 2020e | 2021e | 2022e |
|---|---|---|---|---|---|---|---|---|---|---|---|---|---|---|---|
| Argentina | 11.48 | 9.30 | 10.62 | 10.30 | 9.84 | 9.90 | 6.81 | 6.47 | 6.19 | 5.89 | 5.67 | 5.40 | 1.67 | 2.20 | 5.37 |
| Colombia | 3.96 | 3.34 | 3.55 | 3.45 | 3.76 | 3.94 | 4.44 | 3.69 | 3.88 | 3.58 | 3.35 | 3.35 | 1.00 | 1.20 | 2.81 |
| Peru | 5.72 | 5.25 | 5.77 | 5.74 | 5.70 | 5.84 | 6.40 | 6.07 | 5.91 | 5.63 | 5.34 | 5.11 | 1.12 | 1.26 | 2.80 |
Source: Skift Research, Historical data drawn from HVS
| Hotel Revenue (Local Currency) | 2008 | 2009 | 2010 | 2011 | 2012 | 2013 | 2014 | 2015 | 2016 | 2017 | 2018 | 2019 | 2020e | 2021e | 2022e |
|---|---|---|---|---|---|---|---|---|---|---|---|---|---|---|---|
| Argentina (ARS Billion) | 36.29 | 33.91 | 41.53 | 42.52 | 44.70 | 53.95 | 55.09 | 59.54 | 91.28 | 97.31 | 148.45 | 252.78 | 78.34 | 102.94 | 251.30 |
| Colombia (COP Billion) | 7,945.19 | 7,194.98 | 6,737.72 | 6,384.50 | 6,761.55 | 7,370.46 | 8,889.52 | 10,138.86 | 11,849.51 | 10,578.62 | 9,905.08 | 10,994.11 | 3,268.51 | 3,926.05 | 9,224.81 |
| Peru (PEN Billion) | 17.12 | 15.79 | 16.29 | 15.80 | 15.03 | 15.78 | 18.16 | 19.32 | 19.93 | 18.37 | 17.54 | 17.07 | 3.74 | 4.19 | 9.36 |
Source: Skift Research, Historical data drawn from HVS
Size and scale of companies
Enterprise Count
Mexico has more enterprises than Canada given the size of the country and international arrivals in the country. However, the number of enterprises is not in line with the total revenue generated by the sector. To give a perspective, on average, revenue per enterprise in Mexico was approximately $1.5 million in 2019 while revenue per enterprise in Canada was around $2.9 million.
| Enterprise count | 2008 | 2009 | 2010 | 2011 | 2012 | 2013 | 2014 | 2015 | 2016 | 2017 | 2018 | 2019 |
|---|---|---|---|---|---|---|---|---|---|---|---|---|
| Canada | 5,407 | 5,451 | 5,497 | 5,563 | 5,591 | 5,619 | 5,648 | 5,705 | 5,756 | 5,803 | 5,862 | 5,921 |
| Mexico | 12,154 | 12,485 | 12,981 | 13,303 | 13,592 | 13,999 | 14,393 | 15,414 | 16,219 | 16,898 | 17,354 | 18,230 |
| Argentina | – | – | – | – | – | – | – | – | – | – | – | – |
| Colombia | – | – | – | – | – | – | – | – | – | – | – | – |
| Peru | – | – | – | – | – | – | – | – | – | – | – | – |
Note: Data for a few countries is missing as no credible public source found
Source: Skift Research, UNWTO
Establishment Count
Enterprises in Canada consist of approximately 1.4 establishments per enterprise while in Mexico enterprises consist of 1.3 establishments per enterprise indicating that the Mexican hotel market is slightly more fragmented than the hotel sector in Canada. A fragmented market typically consists of many companies under different ownership that compete within an overall industry, however, none of these small and medium organizations are dominant over the entire market within it while in a more mature market the number of owners are relatively less and hence, are in a position to dominate the industry.
| Establishment count | 2008 | 2009 | 2010 | 2011 | 2012 | 2013 | 2014 | 2015 | 2016 | 2017 | 2018 | 2019 |
|---|---|---|---|---|---|---|---|---|---|---|---|---|
| Canada | 7,569 | 7,632 | 7,695 | 7,789 | 7,828 | 7,867 | 7,907 | 7,987 | 8,059 | 8,124 | 8,206 | 8,289 |
| Mexico | 15,800 | 16,231 | 16,875 | 17,294 | 17,669 | 18,199 | 18,711 | 20,038 | 21,085 | 21,967 | 22,560 | 23,699 |
| Argentina | 11,377 | 12,124 | 12,662 | 13,398 | 13,526 | 14,907 | 15,591 | 15,754 | 15,195 | 15,579 | 15,687 | 15,687 |
| Colombia | 5,845 | 5,845 | 5,778 | 5,662 | 7,228 | 7,409 | 8,805 | 9,945 | 11,140 | 13,008 | 15,530 | 21,447 |
| Peru | 11,381 | 12,295 | 13,463 | 14,474 | 15,509 | 16,671 | 18,058 | 19,522 | 20,635 | 21,600 | 22,115 | 23,908 |
Source: Skift Research, UNWTO
| Establishments per Enterprise | 2008 | 2009 | 2010 | 2011 | 2012 | 2013 | 2014 | 2015 | 2016 | 2017 | 2018 | 2019 |
|---|---|---|---|---|---|---|---|---|---|---|---|---|
| Canada | 1.4 | 1.4 | 1.4 | 1.4 | 1.4 | 1.4 | 1.4 | 1.4 | 1.4 | 1.4 | 1.4 | 1.4 |
| Mexico | 1.3 | 1.3 | 1.3 | 1.3 | 1.3 | 1.3 | 1.3 | 1.3 | 1.3 | 1.3 | 1.3 | 1.3 |
| Argentina | – | – | – | – | – | – | – | – | – | – | – | – |
| Colombia | – | – | – | – | – | – | – | – | – | – | – | – |
| Peru | – | – | – | – | – | – | – | – | – | – | – | – |
Note: Data for a few countries is missing as no credible public source found
Source: Skift Research, UNWTO
Rooms per Establishment
Canada and Mexico hotels have had 36 rooms per establishment on an average between 2008 and 2019.
| Rooms per establishment | 2008 | 2009 | 2010 | 2011 | 2012 | 2013 | 2014 | 2015 | 2016 | 2017 | 2018 | 2019 |
|---|---|---|---|---|---|---|---|---|---|---|---|---|
| Canada | 33 | 32 | 36 | 40 | 41 | 40 | 36 | 31 | 30 | 34 | 35 | 35 |
| Mexico | 38 | 38 | 38 | 38 | 37 | 37 | 37 | 37 | 36 | 36 | 36 | 35 |
| Argentina | – | – | – | – | – | – | – | – | – | – | – | – |
| Colombia | – | – | – | – | – | – | – | – | – | – | – | – |
| Peru | – | – | – | – | – | – | – | – | – | – | – | – |
Note: Data for a few countries is missing as no credible public source found
Source: Skift Research, UNWTO
Persons Employed
The primary determinant of enterprise scale is the number of employees. In general, companies with 250 employees are considered as large businesses, those with 50-249 employees are medium-sized, those with 10-49 are small business and lastly, those with fewer than 10 employees are considered as micro companies. The latter three categories often get aggregated into the group “small and medium enterprises” (SMEs).
For Canada and Mexico, we can surmise that the hotels in these two countries, which have less than 49 staff per establishment will have more number of small and micro hotel entities.
| Country | Persons Employed | 2008 | 2009 | 2010 | 2011 | 2012 | 2013 | 2014 | 2015 | 2016 | 2017 | 2018 | 2019 |
|---|---|---|---|---|---|---|---|---|---|---|---|---|---|
| Canada | 101,321 | 96,243 | 96,591 | 98,188 | 98,844 | 99,683 | 100,072 | 104,412 | 107,934 | 111,455 | 113,645 | 116,983 | |
| Per Establishment | 13 | 13 | 13 | 13 | 13 | 13 | 13 | 13 | 13 | 14 | 14 | 14 | |
| Per Enterprise | 19 | 18 | 18 | 18 | 18 | 18 | 18 | 18 | 19 | 19 | 19 | 20 | |
| Per Room | 0.4 | 0.4 | 0.3 | 0.3 | 0.3 | 0.3 | 0.3 | 0.4 | 0.4 | 0.4 | 0.4 | 0.4 | |
| Mexico | 149,290 | 140,565 | 146,775 | 142,250 | 140,799 | 144,366 | 148,521 | 155,017 | 158,047 | 158,914 | 159,400 | 159,400 | |
| Per Establishment | 9 | 9 | 9 | 8 | 8 | 8 | 8 | 8 | 7 | 7 | 7 | 7 | |
| Per Enterprise | 12 | 11 | 11 | 11 | 10 | 10 | 10 | 10 | 10 | 9 | 9 | 9 | |
| Per Room | 0.2 | 0.2 | 0.2 | 0.2 | 0.2 | 0.2 | 0.2 | 0.2 | 0.2 | 0.2 | 0.2 | 0.2 | |
| Argentina | |||||||||||||
| Per Establishment | – | – | – | – | – | – | – | – | – | – | – | – | |
| Per Enterprise | – | – | – | – | – | – | – | – | – | – | – | – | |
| Per Room | – | – | – | – | – | – | – | – | – | – | – | – | |
| Colombia | |||||||||||||
| Per Establishment | – | – | – | – | – | – | – | – | – | – | – | – | |
| Per Enterprise | – | – | – | – | – | – | – | – | – | – | – | – | |
| Per Room | – | – | – | – | – | – | – | – | – | – | – | – | |
| Peru | |||||||||||||
| Per Establishment | – | – | – | – | – | – | – | – | – | – | – | – | |
| Per Enterprise | – | – | – | – | – | – | – | – | – | – | – | – | |
| Per Room | – | – | – | – | – | – | – | – | – | – | – | – |
Note: Data for a few countries is missing as no credible public source found
Source: Skift Research, Statistics Canada
Key Performance Indicators
Revenue Per Available Room
Revenue per available room (RevPAR) is a strategic metric for any hotel because it identifies the hotel’s ability to manage both occupancy (rooms sold) and the average daily room rate, so as to maximize room revenues. TRevPAR assesses the total income a hotel generates on a per-available-room basis and gives an insight into the overall performance of the hotel. In order to increase the overall revenue of the hotel, it is important to understand the impact each department has on a hotel’s overall performance, particularly for full-service hotels, which tend to feature the most amenities.
The tables below provide the TRevPAR and RevPAR of the five American countries. Canada stands out with a TRevPAR of $159 in 2019. TRevPAR of hotels in Canada increased at a CAGR of 4% from 2008 to 2019. While TRevPAR of hotels in Mexico increased from $53 in 2008 to $88 in 2019, at a CAGR of 5%.
TRevPAR and RevPAR of Argentina, Colombia and Peru show a declining trend because of the declining trend in hotel revenues owing to currency depreciation as mentioned above.
| TRevPAR ( in USD) | 2008 | 2009 | 2010 | 2011 | 2012 | 2013 | 2014 | 2015 | 2016 | 2017 | 2018 | 2019 |
|---|---|---|---|---|---|---|---|---|---|---|---|---|
| Canada | 105.72 | 109.04 | 112.54 | 113.50 | 116.52 | 121.02 | 129.45 | 132.91 | 138.86 | 146.44 | 154.62 | 159.02 |
| Mexico | 53.43 | 35.36 | 52.42 | 61.04 | 69.15 | 75.68 | 87.57 | 98.02 | 100.37 | 98.04 | 93.94 | 87.57 |
| Argentina | 148.97 | 115.86 | 128.28 | 120.89 | 113.94 | 107.38 | 72.32 | 67.87 | 65.40 | 61.43 | 58.66 | 55.82 |
| Colombia | 79.53 | 66.98 | 71.16 | 67.77 | 64.54 | 61.46 | 61.15 | 45.36 | 45.29 | 38.94 | 34.01 | 29.61 |
| Peru | 88.67 | 76.85 | 79.80 | 76.02 | 72.41 | 68.98 | 71.46 | 63.99 | 59.57 | 53.73 | 49.28 | 45.03 |
Source: Skift Research, Cushman and Wakefield, STR, HVS
As mentioned above, RevPAR measures room revenues on a per-available-room basis while TRevPAR helps measure the overall revenue on a per-available-room basis. Hence, effectively when we divide TRevPAR by RevPAR we can get an idea of the percentage of revenues that come from selling rooms and the percentage of revenues that come from other departments i.e. ancillary revenues. For example, the RevPAR of hotels in Canada is 70% of their TRevPAR in 2019 indicating that 70% of the total revenue comes from rooms. Similarly, the RevPAR of hotels in Mexico is 80% of their TRevPAR in 2019 indicating that 80% of the total revenue comes from rooms.
Data from the World Bank suggests that 37% of the tourism spending in Canada comes from business tourism while only 12% of the tourism spending in Mexico comes from business tourism. The fact that business tourists tend to spend more on ancillary services in a hotel than leisure tourists can be a major factor for the discrepancy in the room revenue contribution to the overall revenue in the hotels in these two countries.
| RevPAR ( in USD) | 2008 | 2009 | 2010 | 2011 | 2012 | 2013 | 2014 | 2015 | 2016 | 2017 | 2018 | 2019 |
|---|---|---|---|---|---|---|---|---|---|---|---|---|
| Canada | 73.57 | 75.87 | 78.31 | 78.98 | 81.08 | 84.21 | 89.06 | 91.71 | 95.95 | 102.95 | 108.39 | 111.63 |
| Mexico | 42.52 | 28.14 | 41.72 | 48.58 | 55.03 | 60.23 | 69.01 | 77.43 | 79.39 | 78.73 | 75.25 | 70.23 |
| Argentina | 126.00 | 98.00 | 108.50 | 102.26 | 96.37 | 90.83 | 60.60 | 57.01 | 55.00 | 52.40 | 49.92 | 47.56 |
| Colombia | 71.25 | 60.00 | 63.75 | 60.71 | 57.81 | 55.06 | 54.30 | 40.37 | 40.35 | 35.17 | 30.65 | 26.71 |
| Peru | 75.00 | 65.00 | 67.50 | 64.30 | 61.25 | 58.34 | 59.88 | 53.75 | 50.10 | 45.84 | 41.93 | 38.36 |
Source: Skift Research, Cushman and Wakefield, STR, HVS
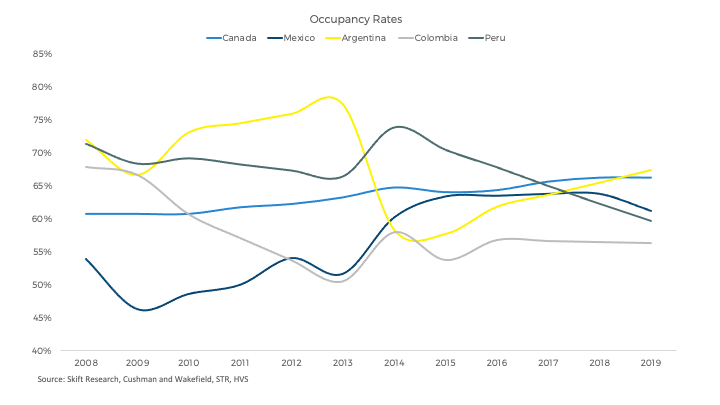
Occupancy
While the occupancy rates of hotels in Canada and Mexico have risen consistently from 2008 to 2019, occupancy rates of hotels in the South American countries – Argentina, Colombia and Peru – show a declining trend. GDP of the region fell considerably beginning in 2010 until 2014 before the region fell into recession in 2015. The economic slowdown in the region explains the declining trend in occupancy rates in the three main countries of this region. While Colombia and Argentina seem to have recovered post recession, occupancy rates in Peru continued to fall.
Pricing
ADRs of hotels in Canada and Mexico were above $100 in 2019. High ADRs along with relatively high occupancy rates in these two countries explains the high TRevPAR of hotels in Canada and Mexico. ADRs of the Latin American countries show a declining trend in line with their declining revenue and other KPIs.
| ADR (in USD) | 2008 | 2009 | 2010 | 2011 | 2012 | 2013 | 2014 | 2015 | 2016 | 2017 | 2018 | 2019 |
|---|---|---|---|---|---|---|---|---|---|---|---|---|
| Canada | 121.00 | 124.79 | 128.71 | 127.85 | 130.12 | 133.08 | 137.36 | 142.98 | 149.02 | 156.72 | 163.40 | 168.37 |
| Mexico | 78.80 | 60.77 | 85.77 | 97.11 | 101.72 | 116.49 | 114.44 | 121.94 | 124.83 | 123.20 | 117.76 | 114.57 |
| Argentina | 175.00 | 147.00 | 148.40 | 137.23 | 126.91 | 117.36 | 103.89 | 98.82 | 88.96 | 82.35 | 76.23 | 70.57 |
| Colombia | 105.00 | 90.00 | 105.00 | 106.25 | 107.51 | 108.79 | 93.63 | 75.02 | 71.00 | 62.04 | 54.21 | 47.37 |
| Peru | 105.00 | 95.00 | 97.50 | 94.14 | 90.90 | 87.76 | 81.01 | 76.22 | 73.82 | 70.47 | 67.27 | 64.22 |
Source: Skift Research, Cushman and Wakefield, STR, HVS
Middle East
Revenue and Forecasts
Out of the three key markets analyzed in the Middle East, Saudi Arabia is the largest hotel market in terms of revenue. We estimate that the hotel sector in Saudi Arabia will generate sales of $14.78 billion in 2022. Hotel sectors in the United Arab Emirates (UAE) and Qatar are expected to generate sales of $8.42 billion and $1.37 billion in 2022.
Saudi Arabia is not only the biggest but also the fastest growing hotel sector amongst the three countries wherein the hotel sector grew at a CAGR of 6% from 2008 to 2022 while UAE and Qatar grew at 3% and 2% respectively.
While the hotel sector revenue in Saudi Arabia and UAE has consistently grown year-on-year, hotel sector revenue in Qatar decreased significantly in 2017 and has not reached the 2016 levels ever since. The Qatar Diplomatic Crisis that began when Saudi Arabia, UAE, Bahrain, and Egypt severed diplomatic relations with Qatar and banned Qatar-registered planes and ships from utilizing their airspace and sea routes, along with Saudi Arabia blocking Qatar’s only land crossing, was majorly responsible for a decline in tourism numbers and hence, the hotel sector revenue.
With respect to recovery from the pandemic, hotel sector revenue in UAE is expected to surpass 2019 levels in 2022, while 2022 hotel sector revenue in Saudi Arabia is expected to be ~90% of 2019 revenue. In Qatar, 2022 revenues are expected to be ~80% of 2019 revenue. The hotel industry in UAE benefited considerably from Expo 2020 Dubai. The mega event recorded over 24 million visits during the six-month-long event in 2021 which helped expedite the recovery of the hospitality sector.
| Hotel Revenue (USD Billion) | 2008 | 2009 | 2010 | 2011 | 2012 | 2013 | 2014 | 2015 | 2016 | 2017 | 2018 | 2019 | 2020e | 2021e | 2022e |
|---|---|---|---|---|---|---|---|---|---|---|---|---|---|---|---|
| UAE | 5.34 | 4.36 | 4.32 | 4.90 | 7.63 | 7.88 | 8.90 | 8.96 | 8.61 | 8.64 | 8.53 | 8.35 | 4.69 | 7.21 | 8.42 |
| Saudi Arabia | 6.54 | 7.18 | 5.94 | 7.32 | 9.42 | 9.83 | 10.66 | 11.26 | 13.40 | 14.28 | 14.62 | 16.26 | 7.50 | 12.42 | 14.78 |
| Qatar | 1.02 | 1.18 | 1.04 | 0.98 | 1.41 | 1.23 | 1.51 | 2.03 | 2.00 | 1.57 | 1.46 | 1.69 | 0.61 | 1.12 | 1.37 |
Source: Skift Research, Historical data drawn from UAE Ministry of Economy
Size and scale of companies
Enterprise Count
Unsurprisingly, Saudi Arabia has the highest number of enterprises in the Middle East region given the sheer size of the country and scale of domestic tourism in the country. However, the number of enterprises is not in line with the total revenue generated by the sector. To give a perspective, on average, revenue per enterprise in Saudi Arabia was approximately $2.2 million in 2019 while revenue per enterprise in UAE was around $9.5 million.
| Enterprise count | 2008 | 2009 | 2010 | 2011 | 2012 | 2013 | 2014 | 2015 | 2016 | 2017 | 2018 | 2019 |
|---|---|---|---|---|---|---|---|---|---|---|---|---|
| UAE | 467 | 579 | 648 | 678 | 692 | 736 | 790 | 812 | 815 | 814 | 851 | 874 |
| Saudi Arabia | 2,326 | 2,364 | 2,435 | 2,745 | 2,828 | 3,228 | 3,361 | 3,995 | 5,449 | 6,454 | 6,629 | 7,528 |
| Qatar | 44 | 53 | 60 | 67 | 74 | 75 | 77 | 108 | 106 | 111 | 113 | 118 |
Source: Skift Research, UNWTO
Establishment Count
Enterprises in the UAE consist of approximately 1.3 establishments per enterprise while in Saudi Arabia and Qatar enterprises consist of 1.1 establishments per enterprise indicating that the Saudi Arabia and Qatar hotel market is slightly more fragmented than the hotel sector in the UAE.
As per an article by Gulf News, around 60% of hotels in Dubai, the top tourist city of UAE, are 4 to 5 star hotels. And as per a report by HVS, Dubai leads the region with respect to the supply of branded hotels. These two data points indicate that, conservatively, UAE can be considered to be a more mature market as compared to Saudi Arabia and Qatar which justifies the difference in their enterprise establishment ratio.
| Establishment count | 2008 | 2009 | 2010 | 2011 | 2012 | 2013 | 2014 | 2015 | 2016 | 2017 | 2018 | 2019 |
|---|---|---|---|---|---|---|---|---|---|---|---|---|
| UAE | 607 | 753 | 843 | 881 | 900 | 957 | 1,027 | 1,056 | 1,060 | 1,058 | 1,106 | 1,136 |
| Saudi Arabia | 2,558 | 2,600 | 2,679 | 3,019 | 3,111 | 3,551 | 3,697 | 4,394 | 5,994 | 7,099 | 7,292 | 8,281 |
| Qatar | 48 | 58 | 66 | 74 | 81 | 83 | 85 | 119 | 117 | 122 | 124 | 130 |
Source: Skift Research, UNWTO
| Establishments per Enterprise | 2008 | 2009 | 2010 | 2011 | 2012 | 2013 | 2014 | 2015 | 2016 | 2017 | 2018 | 2019 |
|---|---|---|---|---|---|---|---|---|---|---|---|---|
| UAE | 1.3 | 1.3 | 1.3 | 1.3 | 1.3 | 1.3 | 1.3 | 1.3 | 1.3 | 1.3 | 1.3 | 1.3 |
| Saudi Arabia | 1.1 | 1.1 | 1.1 | 1.1 | 1.1 | 1.1 | 1.1 | 1.1 | 1.1 | 1.1 | 1.1 | 1.1 |
| Qatar | 1.1 | 1.1 | 1.1 | 1.1 | 1.1 | 1.1 | 1.1 | 1.1 | 1.1 | 1.1 | 1.1 | 1.1 |
Source: Skift Research, UNWTO
Rooms per Establishment
While UAE and Qatar’s hotels had more than 150 rooms per establishment in 2019, Saudi Arabia’s hotels had approximately 73 rooms per establishment in the same year.
| Rooms per establishment | 2008 | 2009 | 2010 | 2011 | 2012 | 2013 | 2014 | 2015 | 2016 | 2017 | 2018 | 2019 |
|---|---|---|---|---|---|---|---|---|---|---|---|---|
| UAE | 95 | 85 | 88 | 92 | 134 | 131 | 138 | 141 | 147 | 153 | 156 | 161 |
| Saudi Arabia | 79 | 79 | 79 | 81 | 89 | 78 | 82 | 79 | 76 | 75 | 76 | 73 |
| Qatar | 139 | 187 | 145 | 135 | 166 | 164 | 164 | 174 | 196 | 206 | 209 | 210 |
Source: Skift Research, UNWTO
Persons Employed
Hotels in Saudi Arabia, which have less than 49 staff per establishment on an average will have more number of small and micro hotel entities while hotels in UAE, which have around 114 staff per establishment, on an average, will have a higher number of medium sized hotel entities.
| Country | Persons Employed | 2008 | 2009 | 2010 | 2011 | 2012 | 2013 | 2014 | 2015 | 2016 | 2017 | 2018 | 2019 |
|---|---|---|---|---|---|---|---|---|---|---|---|---|---|
| 93,909 | 107,810 | 118,480 | 124,307 | 127,294 | 128,308 | 128,675 | 129,439 | 130,919 | 132,857 | 132,100 | 129,679 | ||
| UAE | Per Establishment | 155 | 143 | 141 | 141 | 141 | 134 | 125 | 123 | 124 | 126 | 119 | 114 |
| Per Enterprise | 201 | 186 | 183 | 183 | 184 | 174 | 163 | 159 | 161 | 163 | 155 | 148 | |
| Per Room | 1.6 | 1.7 | 1.6 | 1.5 | 1.1 | 1.0 | 0.9 | 0.9 | 0.8 | 0.8 | 0.8 | 0.7 | |
| Saudi Arabia | 82,500 | 82,826 | 83,906 | 97,675 | 103,798 | 110,236 | 115,100 | 105,171 | 108,251 | 115,000 | 118,900 | 124,676 | |
| Per Establishment | 32 | 32 | 31 | 32 | 33 | 31 | 31 | 24 | 18 | 16 | 16 | 15 | |
| Per Enterprise | 35 | 35 | 34 | 36 | 37 | 34 | 34 | 26 | 20 | 18 | 18 | 17 | |
| Per Room | 0.4 | 0.4 | 0.4 | 0.4 | 0.4 | 0.4 | 0.4 | 0.3 | 0.2 | 0.2 | 0.2 | 0.2 | |
| Qatar | – | – | – | – | – | – | – | – | – | – | – | – | |
| Per Establishment | – | – | – | – | – | – | – | – | – | – | – | – | |
| Per Enterprise | – | – | – | – | – | – | – | – | – | – | – | – | |
| Per Room | – | – | – | – | – | – | – | – | – | – | – | – |
Note: Data for a few countries is missing as no credible public source found
Source: Skift Research, UNWTO, WorldBank
Key Performance Indicators
Revenue Per Available Room
The tables below provide the TRevPAR and RevPAR of the three Middle Eastern countries in discussion. Qatar clearly stands out with a TRevPAR of $170 and RevPAR of $84 in 2019. This commensurates with the fact that around 87% of the hotels in Qatar are luxury 4 to 5 star hotels, the highest in the region, which have higher ADRs pushing the RevPAR up.
| TRevPAR ( in USD) | 2008 | 2009 | 2010 | 2011 | 2012 | 2013 | 2014 | 2015 | 2016 | 2017 | 2018 | 2019 |
|---|---|---|---|---|---|---|---|---|---|---|---|---|
| UAE | 254.17 | 186.89 | 159.67 | 164.74 | 173.00 | 171.72 | 172.44 | 165.17 | 151.54 | 145.99 | 134.99 | 124.87 |
| Saudi Arabia | 88.81 | 96.04 | 77.12 | 82.08 | 93.68 | 97.41 | 96.19 | 88.36 | 80.06 | 73.79 | 72.31 | 73.46 |
| Qatar | 419.21 | 298.21 | 299.04 | 268.49 | 287.93 | 248.37 | 296.75 | 268.45 | 238.47 | 171.23 | 154.80 | 170.11 |
Source: Skift Research, UAE Ministry of Economy, HVS, Deloitte, UNWTO, STR
RevPAR of hotels in Qatar is 49% of their TRevPAR in 2019, indicating that 49% of the total revenue comes from rooms while the RevPAR of hotels in UAE and Saudi Arabia is 63% and 84% of their respective TRevPAR in 2019.
The ratio of the RevPAR and TRevPAR is consistent with the proportion of business tourism spending vs. leisure tourism spending in these countries in 2019. Data from the World Bank suggests that Qatar witnessed the highest share of business tourism spending at 40% followed by UAE at 23% and Saudi Arabia at 20%.
| RevPAR ( in USD) | 2008 | 2009 | 2010 | 2011 | 2012 | 2013 | 2014 | 2015 | 2016 | 2017 | 2018 | 2019 |
|---|---|---|---|---|---|---|---|---|---|---|---|---|
| UAE | 154.44 | 113.56 | 97.02 | 100.10 | 105.12 | 104.34 | 68.70 | 102.10 | 92.92 | 89.66 | 84.00 | 78.49 |
| Saudi Arabia | 76.17 | 82.37 | 66.14 | 70.40 | 80.34 | 83.54 | 83.18 | 76.58 | 68.61 | 63.28 | 61.87 | 62.03 |
| Qatar | 212.80 | 151.38 | 151.80 | 136.29 | 146.16 | 126.08 | 152.76 | 138.69 | 120.90 | 86.90 | 78.26 | 84.08 |
Source: Skift Research, UAE Ministry of Economy, HVS, Deloitte, UNWTO, STR
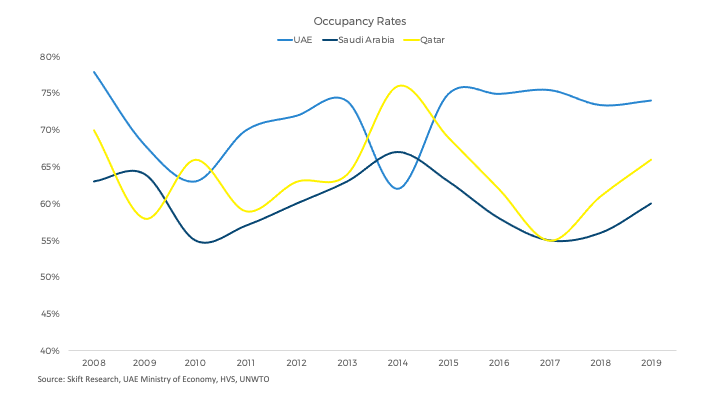
Occupancy
The occupancy rates of the Middle Eastern countries plummeted in 2009-2010 as a result of the Global Financial Crisis. Occupancy rates in Qatar picked up in 2010 while occupancy rates in UAE and Saudi Arabia lagged behind and started picking up in 2011. Occupancy rates in the UAE have been stable since then. except for a down year in 2014 because of an increase in supply of hotels in two main tourist cities of the country – Dubai and Abu Dhabi.
Occupancy rates of hotels in Qatar witnessed a spike in 2014 because of a diverse range of events and activities, including Grand Prix motorcycle racing, in Qatar, along with a remarkable increase in regional and international marketing campaigns in 2014 as reported by Qatar Tourism Authority.
As mentioned above, the occupancy rates and hence the hotel revenue in Qatar and Saudi Arabia tanked in 2017 because of the Qatar Diplomatic Crisis.
Pricing
In 2019, ADRs of hotels in Saudi Arabia were the highest in the region followed by Qatar and UAE. However, as mentioned above, RevPAR of Qatar was the highest in 2019 indicating that high occupancy rates pulled up the RevPAR for the hotels in the country.
| ADR (in USD) | 2008 | 2009 | 2010 | 2011 | 2012 | 2013 | 2014 | 2015 | 2016 | 2017 | 2018 | 2019 |
|---|---|---|---|---|---|---|---|---|---|---|---|---|
| UAE | 198.00 | 167.00 | 154.00 | 143.00 | 146.00 | 141.00 | 110.81 | 136.14 | 123.89 | 118.71 | 114.34 | 105.95 |
| Saudi Arabia | 186.00 | 198.00 | 185.00 | 190.00 | 206.00 | 204.00 | 191.00 | 187.00 | 182.00 | 177.00 | 169.96 | 159.04 |
| Qatar | 304.00 | 261.00 | 230.00 | 231.00 | 232.00 | 197.00 | 201.00 | 201.00 | 195.00 | 158.00 | 128.30 | 127.40 |
Source: Skift Research, UAE Ministry of Economy, HVS, Deloitte, UNWTO, STR
Africa
Revenue and Forecasts
We analyzed the accommodation sector of five key markets in Africa – Egypt, Morocco, Nigeria, Kenya, and South Africa. Egypt is the largest hotel market in terms of revenue. We estimate that the hotel sector in Egypt will generate sales of $3.28 billion in 2022. Hotel sector revenue in South Africa and Morocco are expected to be in the range of $2-$3 billion with South Africa at $2.3 billion and Morocco at $2.7 billion in 2022. The accommodation sector in Nigeria and Kenya is relatively small, with the projected revenue to be $0.9 billion and $0.8 billion respectively in 2022.
Hotel bookings and hence hotel revenue in Egypt started plummeting in 2011 following the Arab Spring and militant attacks in the country. The 2011 Revolution in Egypt witnessed the overthrow of President Mubarak; the tourism and hospitality sector was severely affected as unemployment rates increased and multiple tourism companies went bankrupt. In 2014, the hotel sector revenue started increasing again but at a slow pace. It was only in 2019 that the revenue figures surpassed 2010 hotel revenues. However, Covid hit in 2020 and the country’s hotel sector again went into a tailspin.
The South African hotel industry is projected to generate $2.9 billion in revenue in 2022. It must be noted that the hotel revenue of the country shows a declining trend because of the local currency depreciation against USD. When converted to its local currency, the revenue shows an increasing trend except for the years 2020 and 2021 when the pandemic severely hit the accommodation sector in these countries as shown in the table below. Hotel revenues increased at a CAGR of 5% from 2008 to 2019.
Hotel revenues in Morocco started declining in 2012 as a result of declining tourist numbers due to a terrorist attack on a Marrakech cafe in 2011. The attack was considered to be one of the deadliest attacks in the country. The declining trend is also because of depreciation of Moroccan Dirham against USD starting 2014.
Hotel revenues in Nigeria and Kenya consistently increased from 2008 to 2019 before dipping as a result of the impact of the pandemic in 2020.
| Hotel Revenue (USD Billion) | 2008 | 2009 | 2010 | 2011 | 2012 | 2013 | 2014 | 2015 | 2016 | 2017 | 2018 | 2019 | 2020e | 2021e | 2022e |
|---|---|---|---|---|---|---|---|---|---|---|---|---|---|---|---|
| Egypt | 4.11 | 3.99 | 4.63 | 3.17 | 2.51 | 1.95 | 2.71 | 2.34 | 2.11 | 3.27 | 4.55 | 4.93 | 2.26 | 2.35 | 3.28 |
| South Africa | 2.65 | 2.75 | 4.33 | 4.50 | 4.11 | 3.58 | 3.29 | 2.88 | 2.64 | 3.07 | 3.08 | 2.88 | 1.16 | 1.24 | 2.28 |
| Morocco | 2.71 | 2.60 | 3.13 | 3.43 | 2.98 | 2.79 | 2.82 | 2.44 | 2.42 | 2.65 | 2.64 | 2.60 | 1.58 | 1.64 | 2.71 |
| Nigeria | 0.54 | 0.61 | 0.68 | 0.76 | 0.84 | 0.92 | 0.90 | 0.89 | 0.93 | 1.11 | 1.42 | 1.70 | 0.50 | 0.52 | 0.88 |
| Kenya | 0.65 | 0.66 | 0.67 | 0.68 | 0.63 | 0.62 | 0.58 | 0.61 | 0.64 | 0.66 | 0.71 | 0.77 | 0.56 | 0.58 | 0.81 |
Source: Skift Research, Statistics South Africa, PWC
| Hotel Revenue (Local Currency) | 2008 | 2009 | 2010 | 2011 | 2012 | 2013 | 2014 | 2015 | 2016 | 2017 | 2018 | 2019 | 2020e | 2021e | 2022e |
|---|---|---|---|---|---|---|---|---|---|---|---|---|---|---|---|
| South Africa (R Billion) | 22,632.00 | 23,076.00 | 31,641.76 | 32,670.65 | 33,733.00 | 34,569.27 | 35,693.36 | 36,854.00 | 38,797.17 | 40,804.57 | 40,806.00 | 41,682.08 | 16,711.04 | 17,930.24 | 32,887.16 |
Source: Skift Research, Statistics South Africa
Size and scale of companies
Enterprise Count
Morocco has the highest number of enterprises in the African region followed by South Africa and Egypt. However, the number of enterprises is not in line with the total revenue generated by the sector. To give a perspective, on average, revenue per enterprise in Egypt was approximately $8.3 million in 2019 while revenue per enterprise in South Africa and Morocco was around $6.5 million and $0.5 million respectively. This is to do with the type of hotels available in the country. For example, Morocco has a number of Riads, which are traditional Moroccan houses converted to hotels, this increases the number of hotels overall, however, the revenue per hotel remains low due to the industry dynamics in the country.
| Enterprise count | 2008 | 2009 | 2010 | 2011 | 2012 | 2013 | 2014 | 2015 | 2016 | 2017 | 2018 | 2019 |
|---|---|---|---|---|---|---|---|---|---|---|---|---|
| Egypt | 1,242 | 1,215 | 1,228 | 1,099 | 1,056 | 1,016 | 1,051 | 1,056 | 1,033 | 1,037 | 1,036 | 1,004 |
| South Africa | 2,153 | 2,344 | 2,340 | 2,225 | 2,214 | 2,209 | 2,241 | 2,271 | 2,379 | 2,504 | 2,503 | 2,519 |
| Morocco | 1,433 | 1,505 | 1,820 | 1,878 | 2,229 | 2,468 | 2,668 | 2,935 | 3,089 | 3,253 | 3,394 | 3,524 |
| Nigeria | – | – | – | – | – | – | – | – | – | – | – | – |
| Kenya | – | – | – | – | – | – | – | – | – | – | – | – |
Note: Data for a few countries is missing as no credible public source found
Source: Skift Research, UNWTO
Establishment Count
Hotel enterprises in the three African countries consist of approximately 1.2 establishments per enterprise indicating that the hotel industry in Africa is highly fragmented. As per a report by Knight Frank, less than 25% of the hotels in these countries are branded or chain hotels validating the fragmented composition of the hotel industry in the region.
| Establishment count | 2008 | 2009 | 2010 | 2011 | 2012 | 2013 | 2014 | 2015 | 2016 | 2017 | 2018 | 2019 |
|---|---|---|---|---|---|---|---|---|---|---|---|---|
| Egypt | 1,490 | 1,458 | 1,473 | 1,319 | 1,267 | 1,219 | 1,261 | 1,267 | 1,239 | 1,244 | 1,243 | 1,205 |
| South Africa | 2,584 | 2,813 | 2,808 | 2,670 | 2,657 | 2,651 | 2,689 | 2,725 | 2,855 | 3,005 | 3,003 | 3,023 |
| Morocco | 1,720 | 1,806 | 2,184 | 2,253 | 2,675 | 2,961 | 3,202 | 3,522 | 3,707 | 3,904 | 4,073 | 4,229 |
| Nigeria | – | – | – | – | – | – | – | – | – | – | – | – |
| Kenya | – | – | – | – | – | – | – | – | – | – | – | – |
Note: Data for a few countries is missing as no credible public source found
Source: Skift Research, UNWTO
| Establishments per Enterprise | 2008 | 2009 | 2010 | 2011 | 2012 | 2013 | 2014 | 2015 | 2016 | 2017 | 2018 | 2019 |
|---|---|---|---|---|---|---|---|---|---|---|---|---|
| Egypt | 1.2 | 1.2 | 1.2 | 1.2 | 1.2 | 1.2 | 1.2 | 1.2 | 1.2 | 1.2 | 1.2 | 1.2 |
| South Africa | 1.2 | 1.2 | 1.2 | 1.2 | 1.2 | 1.2 | 1.2 | 1.2 | 1.2 | 1.2 | 1.2 | 1.2 |
| Morocco | 1.2 | 1.2 | 1.2 | 1.2 | 1.2 | 1.2 | 1.2 | 1.2 | 1.2 | 1.2 | 1.2 | 1.2 |
| Nigeria | – | – | – | – | – | – | – | – | – | – | – | – |
| Kenya | – | – | – | – | – | – | – | – | – | – | – | – |
Note: Data for a few countries is missing as no credible public source found
Source: Skift Research, UNWTO
Rooms per Establishment
While hotels in Egypt had more than 150 rooms per establishment in 2019, hotels in South Africa and Morocco had approximately 30 rooms per establishment in the same year.
| Rooms per establishment | 2008 | 2009 | 2010 | 2011 | 2012 | 2013 | 2014 | 2015 | 2016 | 2017 | 2018 | 2019 |
|---|---|---|---|---|---|---|---|---|---|---|---|---|
| Egypt | 142 | 147 | 153 | 159 | 163 | 164 | 158 | 163 | 164 | 170 | 167 | 168 |
| South Africa | 32 | 30 | 30 | 32 | 32 | 32 | 32 | 32 | 31 | 29 | 30 | 29 |
| Morocco | 42 | 43 | 39 | 39 | 35 | 33 | 33 | 31 | 31 | 30 | 30 | 30 |
| Nigeria | – | – | – | – | – | – | – | – | – | – | – | – |
| Kenya | – | – | – | – | – | – | – | – | – | – | – | – |
Note: Data for a few countries is missing as no credible public source found
Source: Skift Research, UNWTO
Persons Employed
Applying the same definition to the employment data as for the other regions, we can surmise that South Africa and Morocco, which have less than 49 staff per establishment will have more number of small and micro hotel entities while Egypt which has around 111 staff per establishment will have more number of medium as well as large sized hotel entities.
| Country | Persons Employed | 2008 | 2009 | 2010 | 2011 | 2012 | 2013 | 2014 | 2015 | 2016 | 2017 | 2018 | 2019 |
|---|---|---|---|---|---|---|---|---|---|---|---|---|---|
| Egypt | 165,732 | 162,172 | 162,800 | 137,700 | 153,000 | 133,400 | 128,000 | 153,000 | 137,813 | 138,369 | 138,258 | 134,031 | |
| Per Establishment | 111 | 111 | 111 | 104 | 121 | 109 | 102 | 121 | 111 | 111 | 111 | 111 | |
| Per Enterprise | 133 | 133 | 133 | 125 | 145 | 131 | 122 | 145 | 133 | 133 | 133 | 133 | |
| Per Room | 1 | 1 | 1 | 1 | 1 | 1 | 1 | 1 | 1 | 1 | 1 | 1 | |
| South Africa | 109,000 | 107,600 | 112,700 | 125,300 | 119,400 | 103,400 | 115,400 | 136,100 | 128,700 | 131,400 | 128,000 | 128,000 | |
| Per Establishment | 42 | 38 | 40 | 47 | 45 | 39 | 43 | 50 | 45 | 44 | 43 | 42 | |
| Per Enterprise | 51 | 46 | 48 | 56 | 54 | 47 | 51 | 60 | 54 | 52 | 51 | 51 | |
| Per Room | 1.3 | 1.3 | 1.3 | 1.5 | 1.4 | 1.2 | 1.3 | 1.6 | 1.5 | 1.5 | 1.4 | 1.4 | |
| Morocco | 112,505 | 121,341 | 127,526 | 135,478 | 121,250 | 125,000 | 128,000 | 128,500 | 130,500 | 135,000 | 140,000 | 145,000 | |
| Per Establishment | 65 | 67 | 58 | 60 | 45 | 42 | 40 | 36 | 35 | 35 | 34 | 34 | |
| Per Enterprise | 78 | 81 | 70 | 72 | 54 | 51 | 48 | 44 | 42 | 41 | 41 | 41 | |
| Per Room | 1.5 | 1.6 | 1.5 | 1.5 | 1.3 | 1.3 | 1.2 | 1.2 | 1.1 | 1.1 | 1.1 | 1.1 | |
| Nigeria | – | – | – | – | – | – | – | – | – | – | – | – | |
| Per Establishment | – | – | – | – | – | – | – | – | – | – | – | – | |
| Per Enterprise | – | – | – | – | – | – | – | – | – | – | – | – | |
| Per Room | – | – | – | – | – | – | – | – | – | – | – | – | |
| – | – | – | – | – | – | – | – | – | – | – | – | ||
| Kenya | Per Establishment | – | – | – | – | – | – | – | – | – | – | – | – |
| Per Enterprise | – | – | – | – | – | – | – | – | – | – | – | – | |
| Per Room | – | – | – | – | – | – | – | – | – | – | – | – | |
Note: Data for a few countries is missing as no credible public source found
Source: Skift Research, UNWTO
Key Performance Indicators
Revenue Per Available Room
RevPAR of hotels in Nigeria and Kenya 50% and 60% of their TRevPAR respectively. Such a low proportion of room revenue is in line with the fact that the two countries have the highest proportion of business tourism spending in the region. Morocco, South Africa and Egypt on the other hand have higher proportion of leisure tourism spending and hence the gap between the RevPAR and TRevPAR of their hotels is narrower.
| TRevPAR ( in USD) | 2008 | 2009 | 2010 | 2011 | 2012 | 2013 | 2014 | 2015 | 2016 | 2017 | 2018 | 2019 |
|---|---|---|---|---|---|---|---|---|---|---|---|---|
| Egypt | 53.44 | 51.01 | 56.25 | 41.54 | 33.33 | 26.80 | 37.18 | 31.16 | 28.44 | 42.35 | 60.14 | 66.76 |
| South Africa | 88.40 | 89.65 | 139.23 | 144.45 | 131.36 | 113.99 | 104.07 | 90.29 | 82.10 | 95.14 | 95.13 | 89.20 |
| Morocco | 101.68 | 91.15 | 100.90 | 106.92 | 87.13 | 77.24 | 73.06 | 60.83 | 57.65 | 60.97 | 58.42 | 55.75 |
| Nigeria | 60.66 | 64.88 | 69.39 | 74.22 | 80.68 | 84.09 | 78.59 | 74.14 | 76.26 | 88.14 | 106.12 | 114.21 |
| Kenya | 113.45 | 112.41 | 111.38 | 110.37 | 101.67 | 97.10 | 89.02 | 92.48 | 94.30 | 94.25 | 94.39 | 101.61 |
Source: Skift Research, UNWTO, PWC
| RevPAR ( in USD) | 2008 | 2009 | 2010 | 2011 | 2012 | 2013 | 2014 | 2015 | 2016 | 2017 | 2018 | 2019 |
|---|---|---|---|---|---|---|---|---|---|---|---|---|
| Egypt | 45.42 | 43.36 | 47.81 | 35.31 | 28.33 | 22.78 | 31.60 | 26.48 | 24.18 | 36.00 | 51.12 | 56.74 |
| South Africa | 61.65 | 62.52 | 97.10 | 100.75 | 91.61 | 79.50 | 72.58 | 62.97 | 57.26 | 66.35 | 66.34 | 62.21 |
| Morocco | 70.91 | 63.57 | 70.37 | 74.57 | 60.77 | 53.87 | 50.96 | 42.42 | 40.21 | 42.52 | 40.75 | 38.88 |
| Nigeria | 107.76 | 115.26 | 123.28 | 36.92 | 40.13 | 41.83 | 39.09 | 36.88 | 37.93 | 43.84 | 52.79 | 56.81 |
| Kenya | 67.78 | 67.16 | 66.54 | 65.93 | 60.74 | 58.01 | 53.18 | 55.25 | 56.34 | 56.31 | 56.39 | 60.70 |
Source: Skift Research, UNWTO, PWC
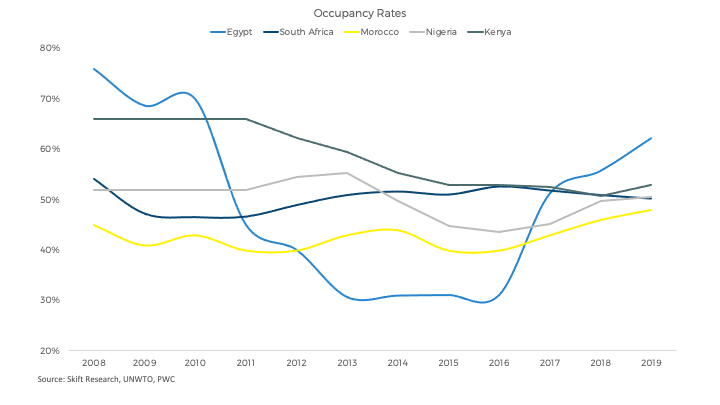
Occupancy
Occupancy rates of hotels in South Africa, Morocco, Nigeria and Kenya have been more or less consistent over 2008 to 2019. Occupancy rates of hotels in Egypt plummeted starting 2010 to 2016 due to political instability of the country during the period as discussed above.
Pricing
In 2019, ADRs of hotels in South Africa were the highest in the region followed by Kenya, Nigeria, Egypt and Morocco.
| ADR (in USD) | 2008 | 2009 | 2010 | 2011 | 2012 | 2013 | 2014 | 2015 | 2016 | 2017 | 2018 | 2019 |
|---|---|---|---|---|---|---|---|---|---|---|---|---|
| Egypt | 59.76 | 63.11 | 68.31 | 78.47 | 70.83 | 74.46 | 102.28 | 85.43 | 77.98 | 66.54 | 91.78 | 91.23 |
| South Africa | 113.96 | 132.46 | 208.82 | 216.19 | 187.35 | 156.19 | 140.66 | 123.47 | 108.86 | 128.09 | 130.34 | 123.93 |
| Morocco | 157.59 | 155.06 | 163.66 | 186.41 | 151.92 | 125.27 | 115.81 | 106.06 | 100.52 | 98.89 | 88.58 | 81.00 |
| Nigeria | 103.62 | 110.83 | 118.54 | 71.00 | 73.50 | 75.50 | 78.50 | 82.50 | 87.00 | 97.00 | 106.00 | 112.50 |
| Kenya | 76.90 | 76.20 | 75.50 | 99.75 | 97.50 | 97.50 | 96.00 | 104.25 | 106.50 | 107.25 | 111.00 | 114.75 |
Source: Skift Research, PWC
Methodology and Definitions
In-Scope Countries and Currency
In our market sizing reports published earlier this year, we presented a country level analysis of the hotel sector in Europe and APAC. We also published a separate report analysing the hotel sector in the U.S. In this report we cover the hotel sector of the countries in the remaining regions i.e. Africa, Middle East and Americas (ex U.S.).
In the African region the key focus is on: Egypt, Morocco, South Africa, Nigeria and Kenya. These top countries were selected on the basis of inbound tourism expenditure in the year 2019. Collectively, they accounted for 60% of overall inbound tourism expenditure in Africa in 2019. To account for the remaining countries, we assume that the remaining countries contribute 35% to the overall revenue.
In the Middle East region the key focus is on: UAE, Saudi Arabia and Qatar. Collectively, they accounted for 70% of overall inbound tourism expenditure in the Middle East in 2019. To account for the remaining countries, we assume that the remaining countries contribute 3% to the overall revenue.
In the Americas, we cover Canada, Mexico, Argentina, Colombia, and Peru in this report and the U.S. in our previous report. The six countries collectively account for 84%of overall inbound tourism expenditure in the Americas in 2019. To account for the remaining countries, we assume that the remaining countries contribute 8% to the overall revenue.
All currency figures in this report are reported in USD. Since all countries covered in this report have their own local currencies, they have been converted to USD using historical exchange rates.
Definitions
Enterprise
This term refers to corporations engaging in businesses/activities and establishments of individual proprietorships. When the same management agency runs multiple establishments of individual proprietorships, all those establishments are regarded as a single enterprise.
Establishment
An establishment is a unit of place which occupies a certain space (1 plot) and in which economic activities are performed under a single management agency.
Sectors
Hotels: This class includes the provision of accommodation, typically on a daily or weekly basis, principally for short stays by visitors. This includes the provision of furnished accommodation in guest rooms and suites. Services include daily cleaning and bed-making. A range of additional services may be provided such as food and beverage services, parking, laundry services, swimming pools and exercise rooms, recreational facilities as well as conference and convention facilities. This class includes accommodation provided by: hotels (and similar establishments, for instance operating under the name ‘bed & breakfast’); resort hotels; suite/apartment hotels; motels.
Short-Term Rentals: This class includes the provision of accommodation, typically on a daily or weekly basis, principally for short stays by visitors, in self-contained space consisting of complete furnished rooms or areas for living/dining and sleeping, with cooking facilities or fully equipped kitchens. This may take the form of apartments or flats in small free-standing multi-storey buildings or clusters of buildings, or single storey bungalows, chalets, cottages and cabins. Very minimal complementary services, if any, are provided.
Methodology
Hotel Revenue Calculation
We gathered data from various government and other credible third-party sources to get revenue figures for the hotel sector at a country level for the key countries in each region (selected on the basis of inbound tourism expenditure in 2019). Wherever this was not possible, we calculated revenue using RevPAR, occupancy and Average Daily Rates (ADRs). The revenue figures presented here are a holistic figure including room revenue, revenue from food and beverages, and other services.
Values for 2020 and 2021 are forecasted based on our Skift Travel Health Index (STHI) scores. Since 2022 STHI scores are currently only available for select countries, we have studied other related factors like the GDP of each country and related it to the STHI score of their close proxy country to come up with the revenue projections of these countries.
To come up with the global hotel sector estimates, the revenue figures of each region were totalled up. Please note that in line with the recent STHI scores and current situation in the regions that we have already covered, projections for certain countries have been revised.
STR Revenue Calculation
To calculate revenues of STRs in the Americas, the Middle East and Africa revenue for the top online booking platforms in the region has been totalled. To account for the remaining online players the revenue from the top players has been increased by 5% for the Americas and Africa and by 10% for the Middle East. To complete the analysis, revenue from offline bookings has been added.
Size & Scale Parameters and Other KPIs
Number of establishments, enterprises and rooms have been sourced from either UNWTO or other credible third party sources. KPIs for certain countries have been calculated using revenue and another KPI or directly sourced from credible sources.