
Report Overview
This report highlights the latest insights from the Skift Travel Health Index. The index covers travel’s performance since January 2020, up to and including April 2023.
The Skift Travel Health Index is a real-time measure of the performance of the travel industry at large, and the core verticals within it. The Index provides the travel industry with a powerful tool for strategic planning, which is of utmost importance as times remain uncertain.
Skift Research launched the Index in May 2020 as the Skift Recovery Index. At the start of 2022 we rebranded the Index as the Skift Travel Health Index, to reflect some far-ranging changes: the addition of many more indicators, additional data partners, and most importantly, our continued effort to track the industry health beyond the impact of the Covid-19 pandemic.
2023 brings two additional data partners into the fold. TravelgateX has started to provide pricing data for hotel stays, and Nium now provides us with transaction values for flights.
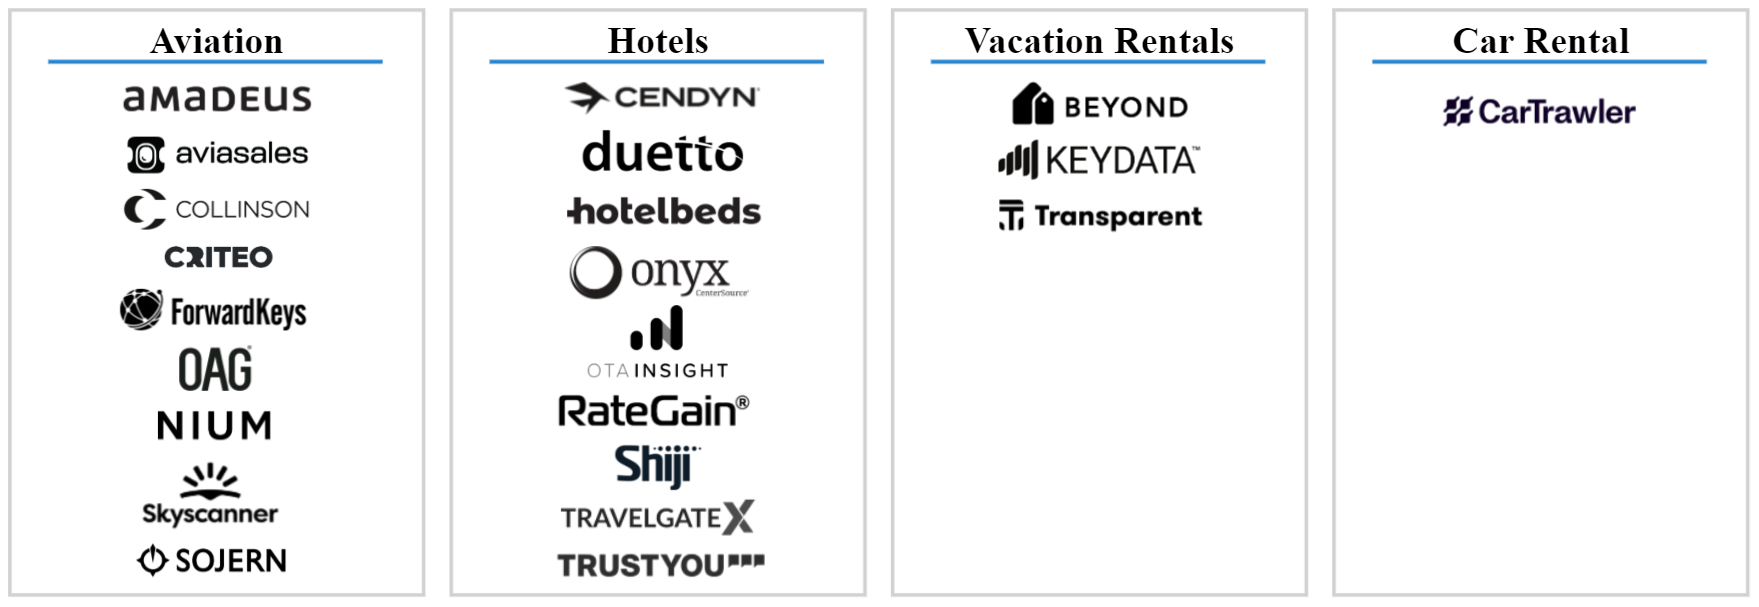
We are also thankful for the continued support of our other data partners: Amadeus, Aviasales, Beyond, CarTrawler, Cendyn, Collinson, Criteo, Duetto, ForwardKeys, Hotelbeds, Key Data Dashboard, OAG, Onyx CenterSource, OTA Insight, RateGain, Shiji Group, Skyscanner, Sojern, Transparent, and TrustYou. Their data allows us to provide you with a monthly assessment of travel’s performance.
Executive Summary
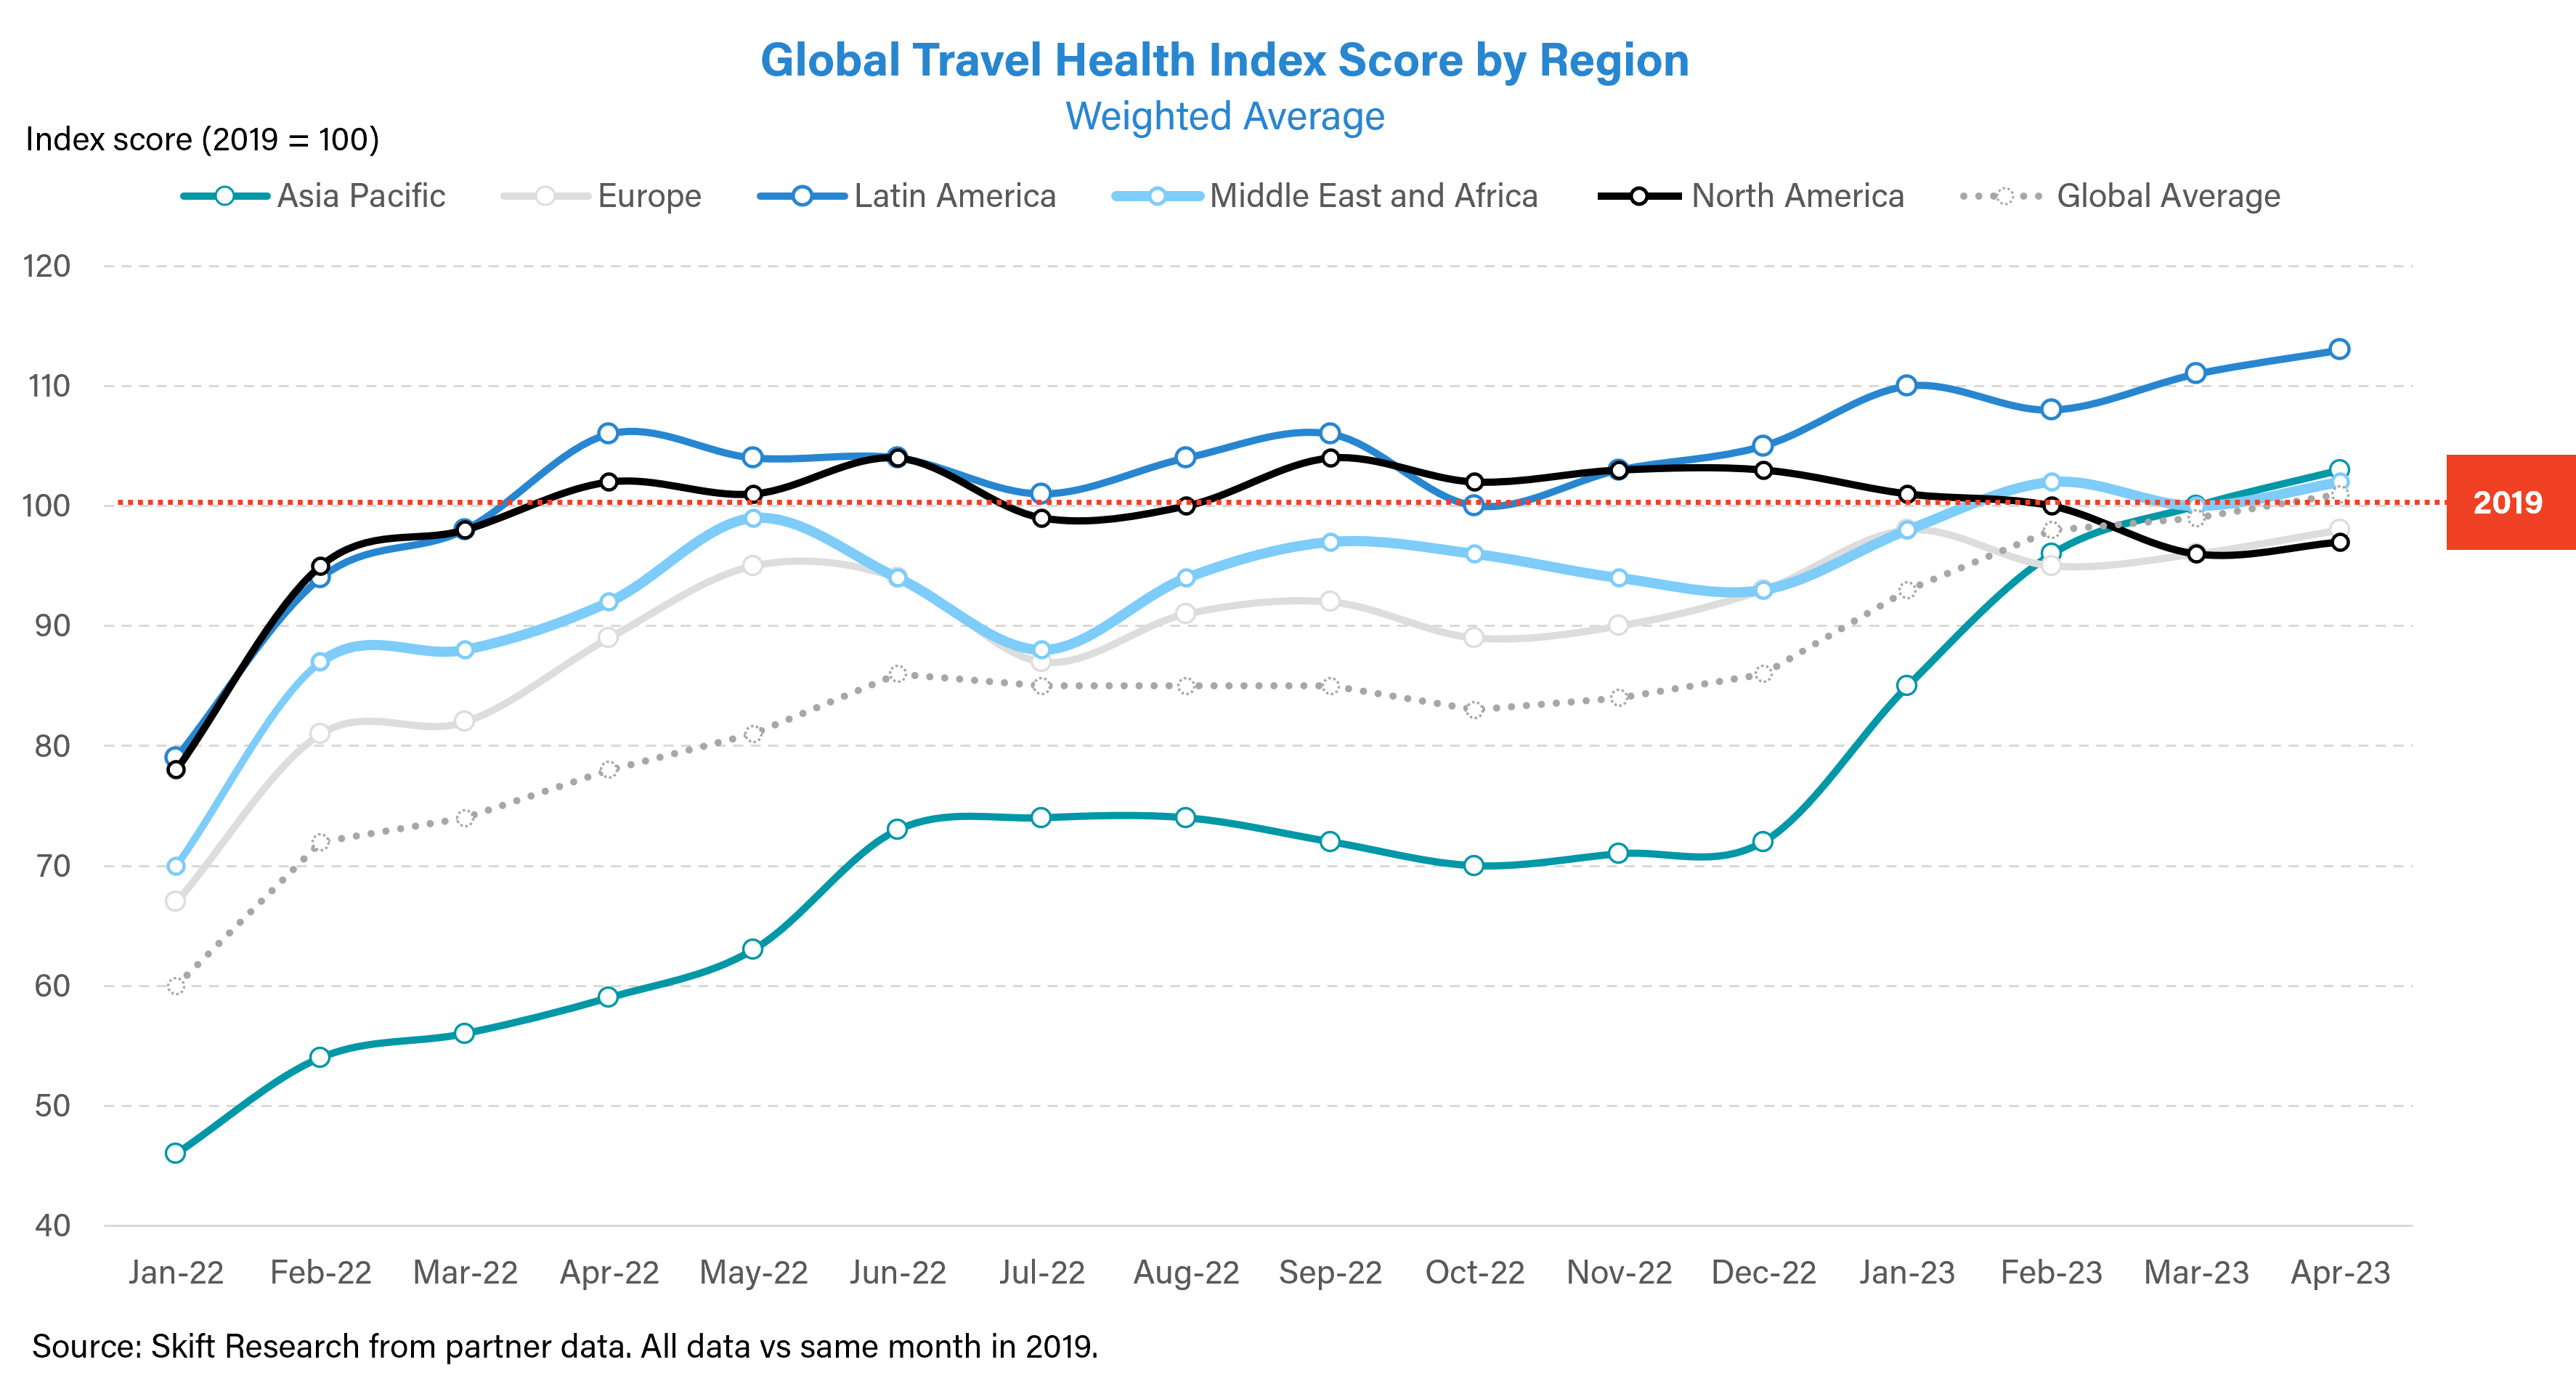
The April 2023 Travel Health Index celebrates the achievement of exceeding 2019 levels in global travel recovery. Several holidays observed globally during the month helped push regional performance. Except for North America and Europe, which are just shy of full recovery, all regions outperformed pre-pandemic levels. The global index currently stands at 101, up 2 percentage points (pp) from the previous month. Strong success across some countries and sectors has helped push the global average even though not all represented by the index have fully recovered.
Travel Performance Exceeds Pre-Pandemic Levels for the First Time
In April 2023, travel performance surpassed that of April 2019. The Travel Health Index increased by 2 percentage points (pp) over March 2023 and now stands at 101, indicating complete travel recovery when looking at the global average. Several holidays including the “Labor Day Golden Week” were observed in the month, providing a much-needed boost to the industry.
At its lowest, the index stood at 20 back in April 2020. This indicates that travel performance dropped to 20% of that in April 2019. The travel rebound has come a long way since then.

Aviation Sector Plays Catch-Up
Looking at sector recovery, all sectors witnessed growth over March 2023. Except for the aviation sector, which is on a steady path to full recovery, all sectors have performed way beyond pre-pandemic levels.
Skift Travel Health Index Performance by Sector
| Sector | Sep-22 | Oct-22 | Nov-22 | Dec-22 | Jan-23 | Feb-23 | Mar-23 | Apr-23 | MoM Growth (abs) |
|---|---|---|---|---|---|---|---|---|---|
| Aviation | 71 | 66 | 70 | 75 | 79 | 84 | 84 | 85 | +1 |
| Hotels | 97 | 88 | 86 | 84 | 99 | 103 | 105 | 107 | +2 |
| Vacation Rentals | 107 | 108 | 109 | 115 | 134 | 138 | 138 | 139 | +1 |
| Car Rental | 96 | 104 | 103 | 98 | 98 | 106 | 109 | 112 | +3 |
The Asia Pacific region has shown growth in aviation performance, but it has continually been below average, slowing recovery.
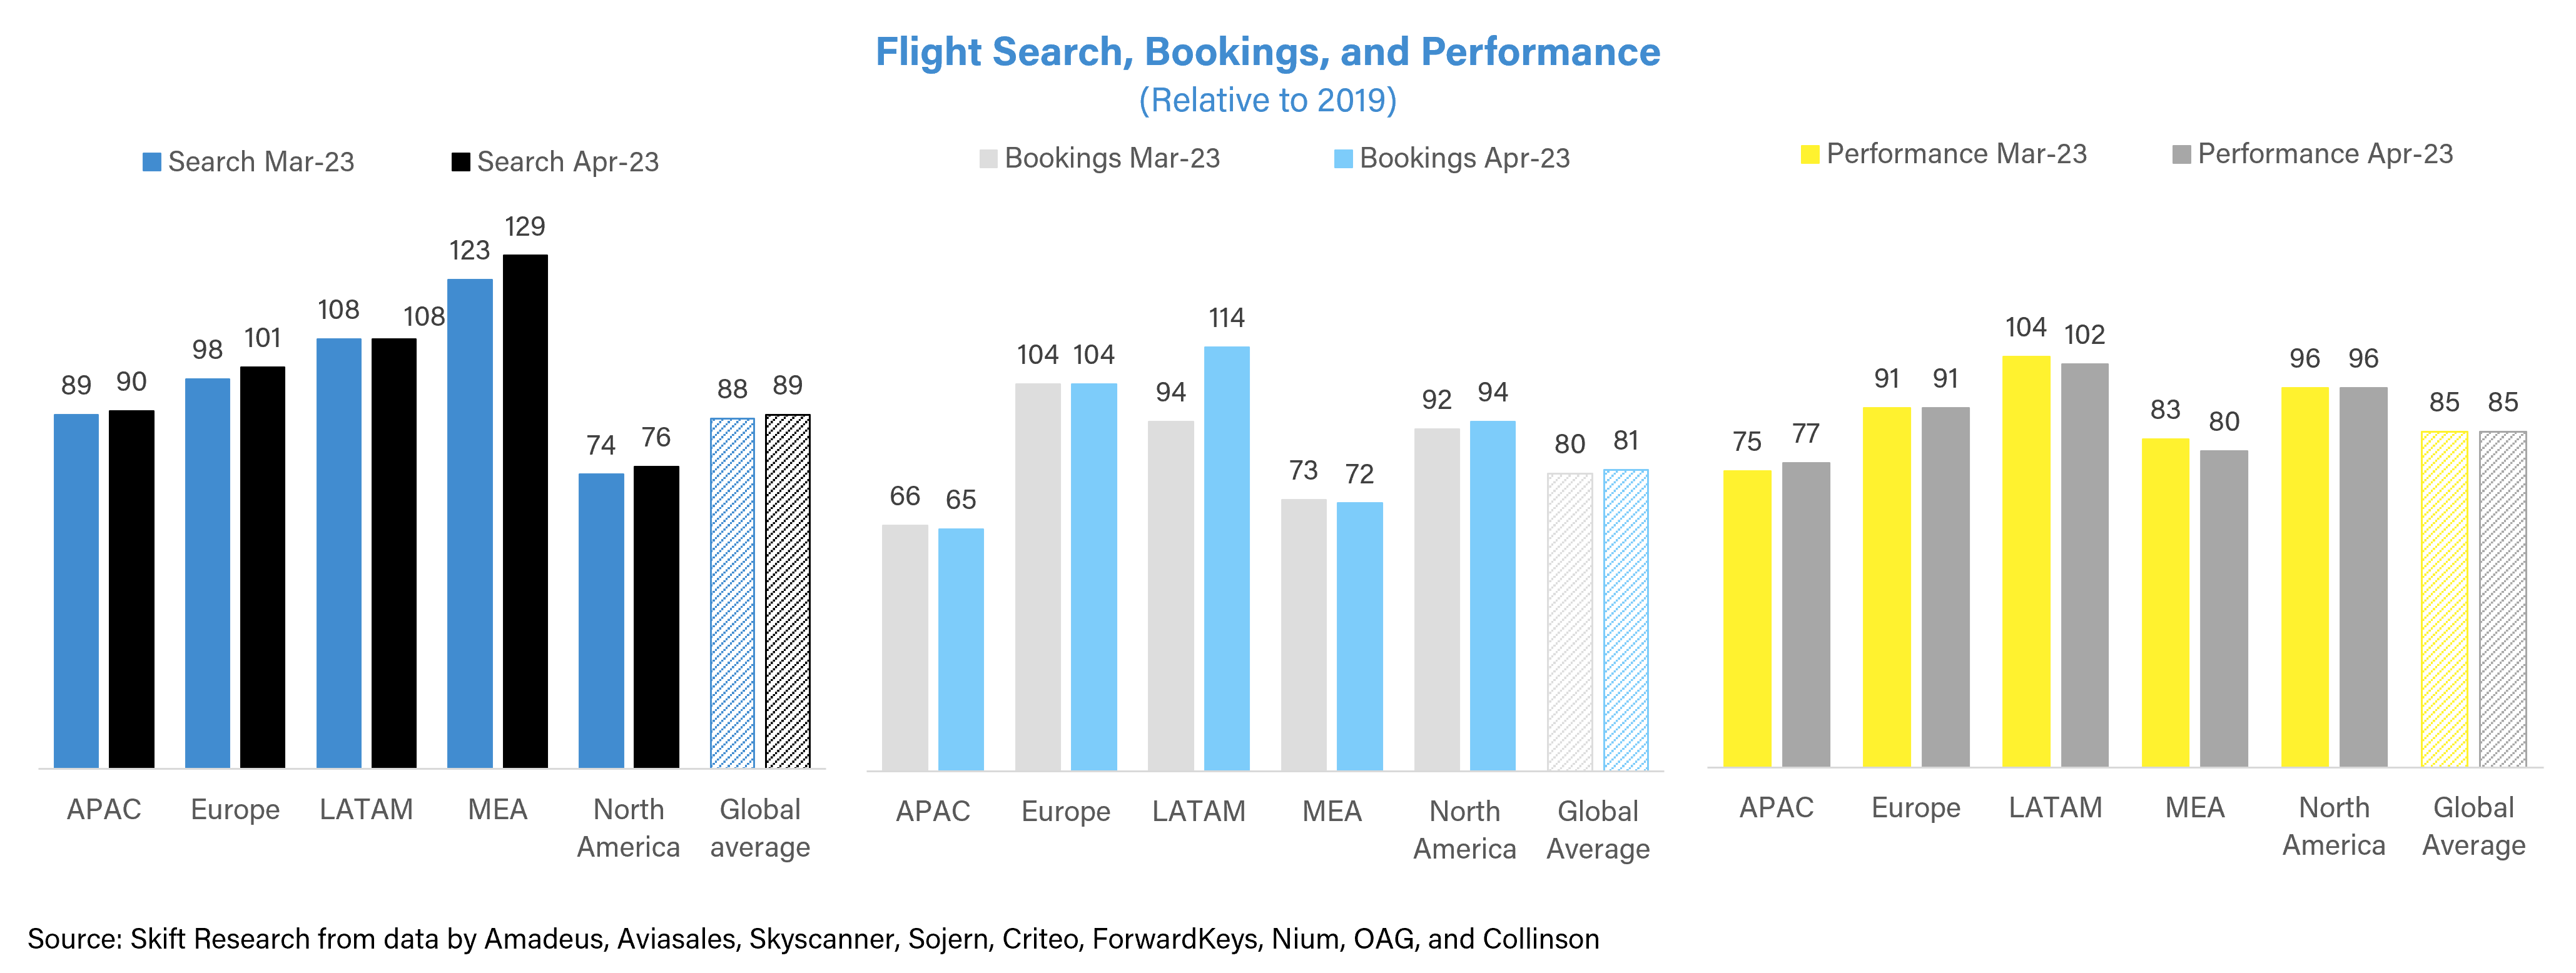
A deep dive into performance metrics segmented by flight searches, bookings, and performance highlights that, while flight searches have been high in all regions except North America, the North American region has recovered 94% of flight bookings in April 2023. Flight bookings in the Asia Pacific, the Middle East, and Africa are low. The same pattern can be seen in flight performance. Latin America has consistently led the way in terms of aviation performance growth.
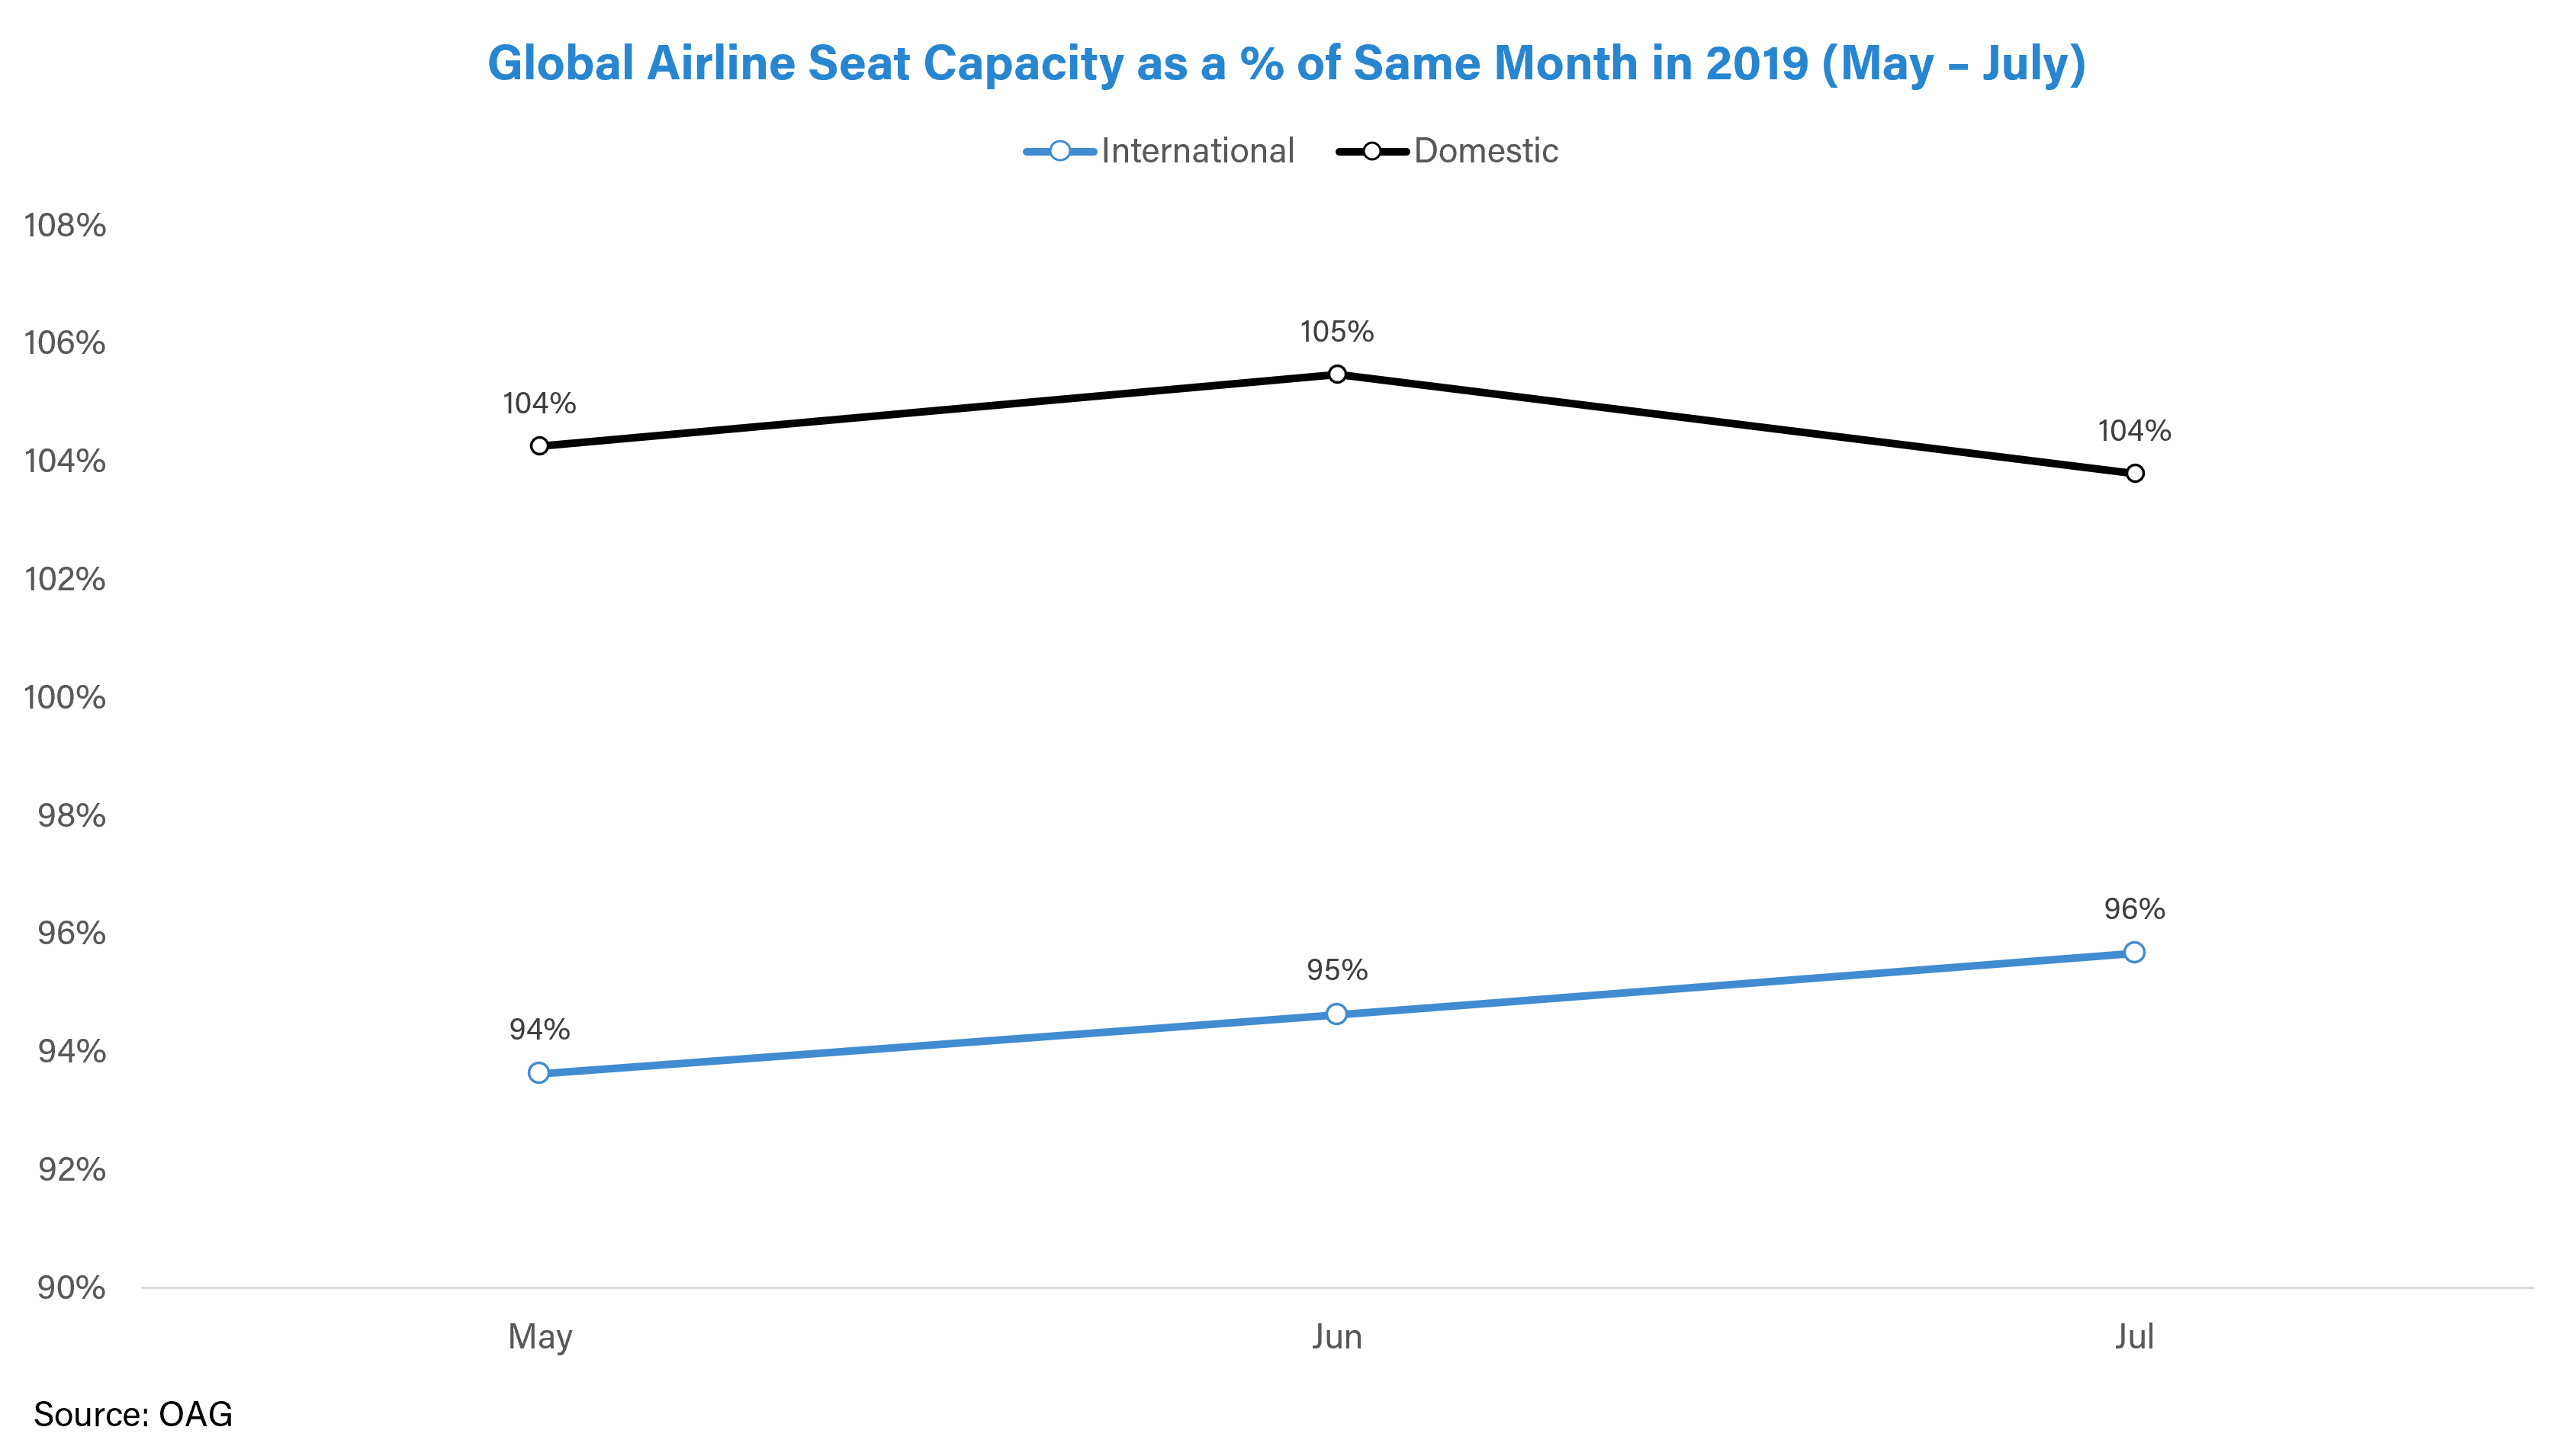
Going forward, we expect the aviation sector to continue its path to recovery this year. Our latest report on the U.S. Airline Sector estimates that U.S. passenger revenue inclusive of direct ticket prices and ancillary sales will witness 17.7% year-on-year growth in 2023. Airline seat capacity is likely to increase in the coming months. Domestic seat capacity is now higher than it was in 2019. International seat capacity is predicted to recover between 94-96% in the next 3 months.
Accommodation Sector Rebound
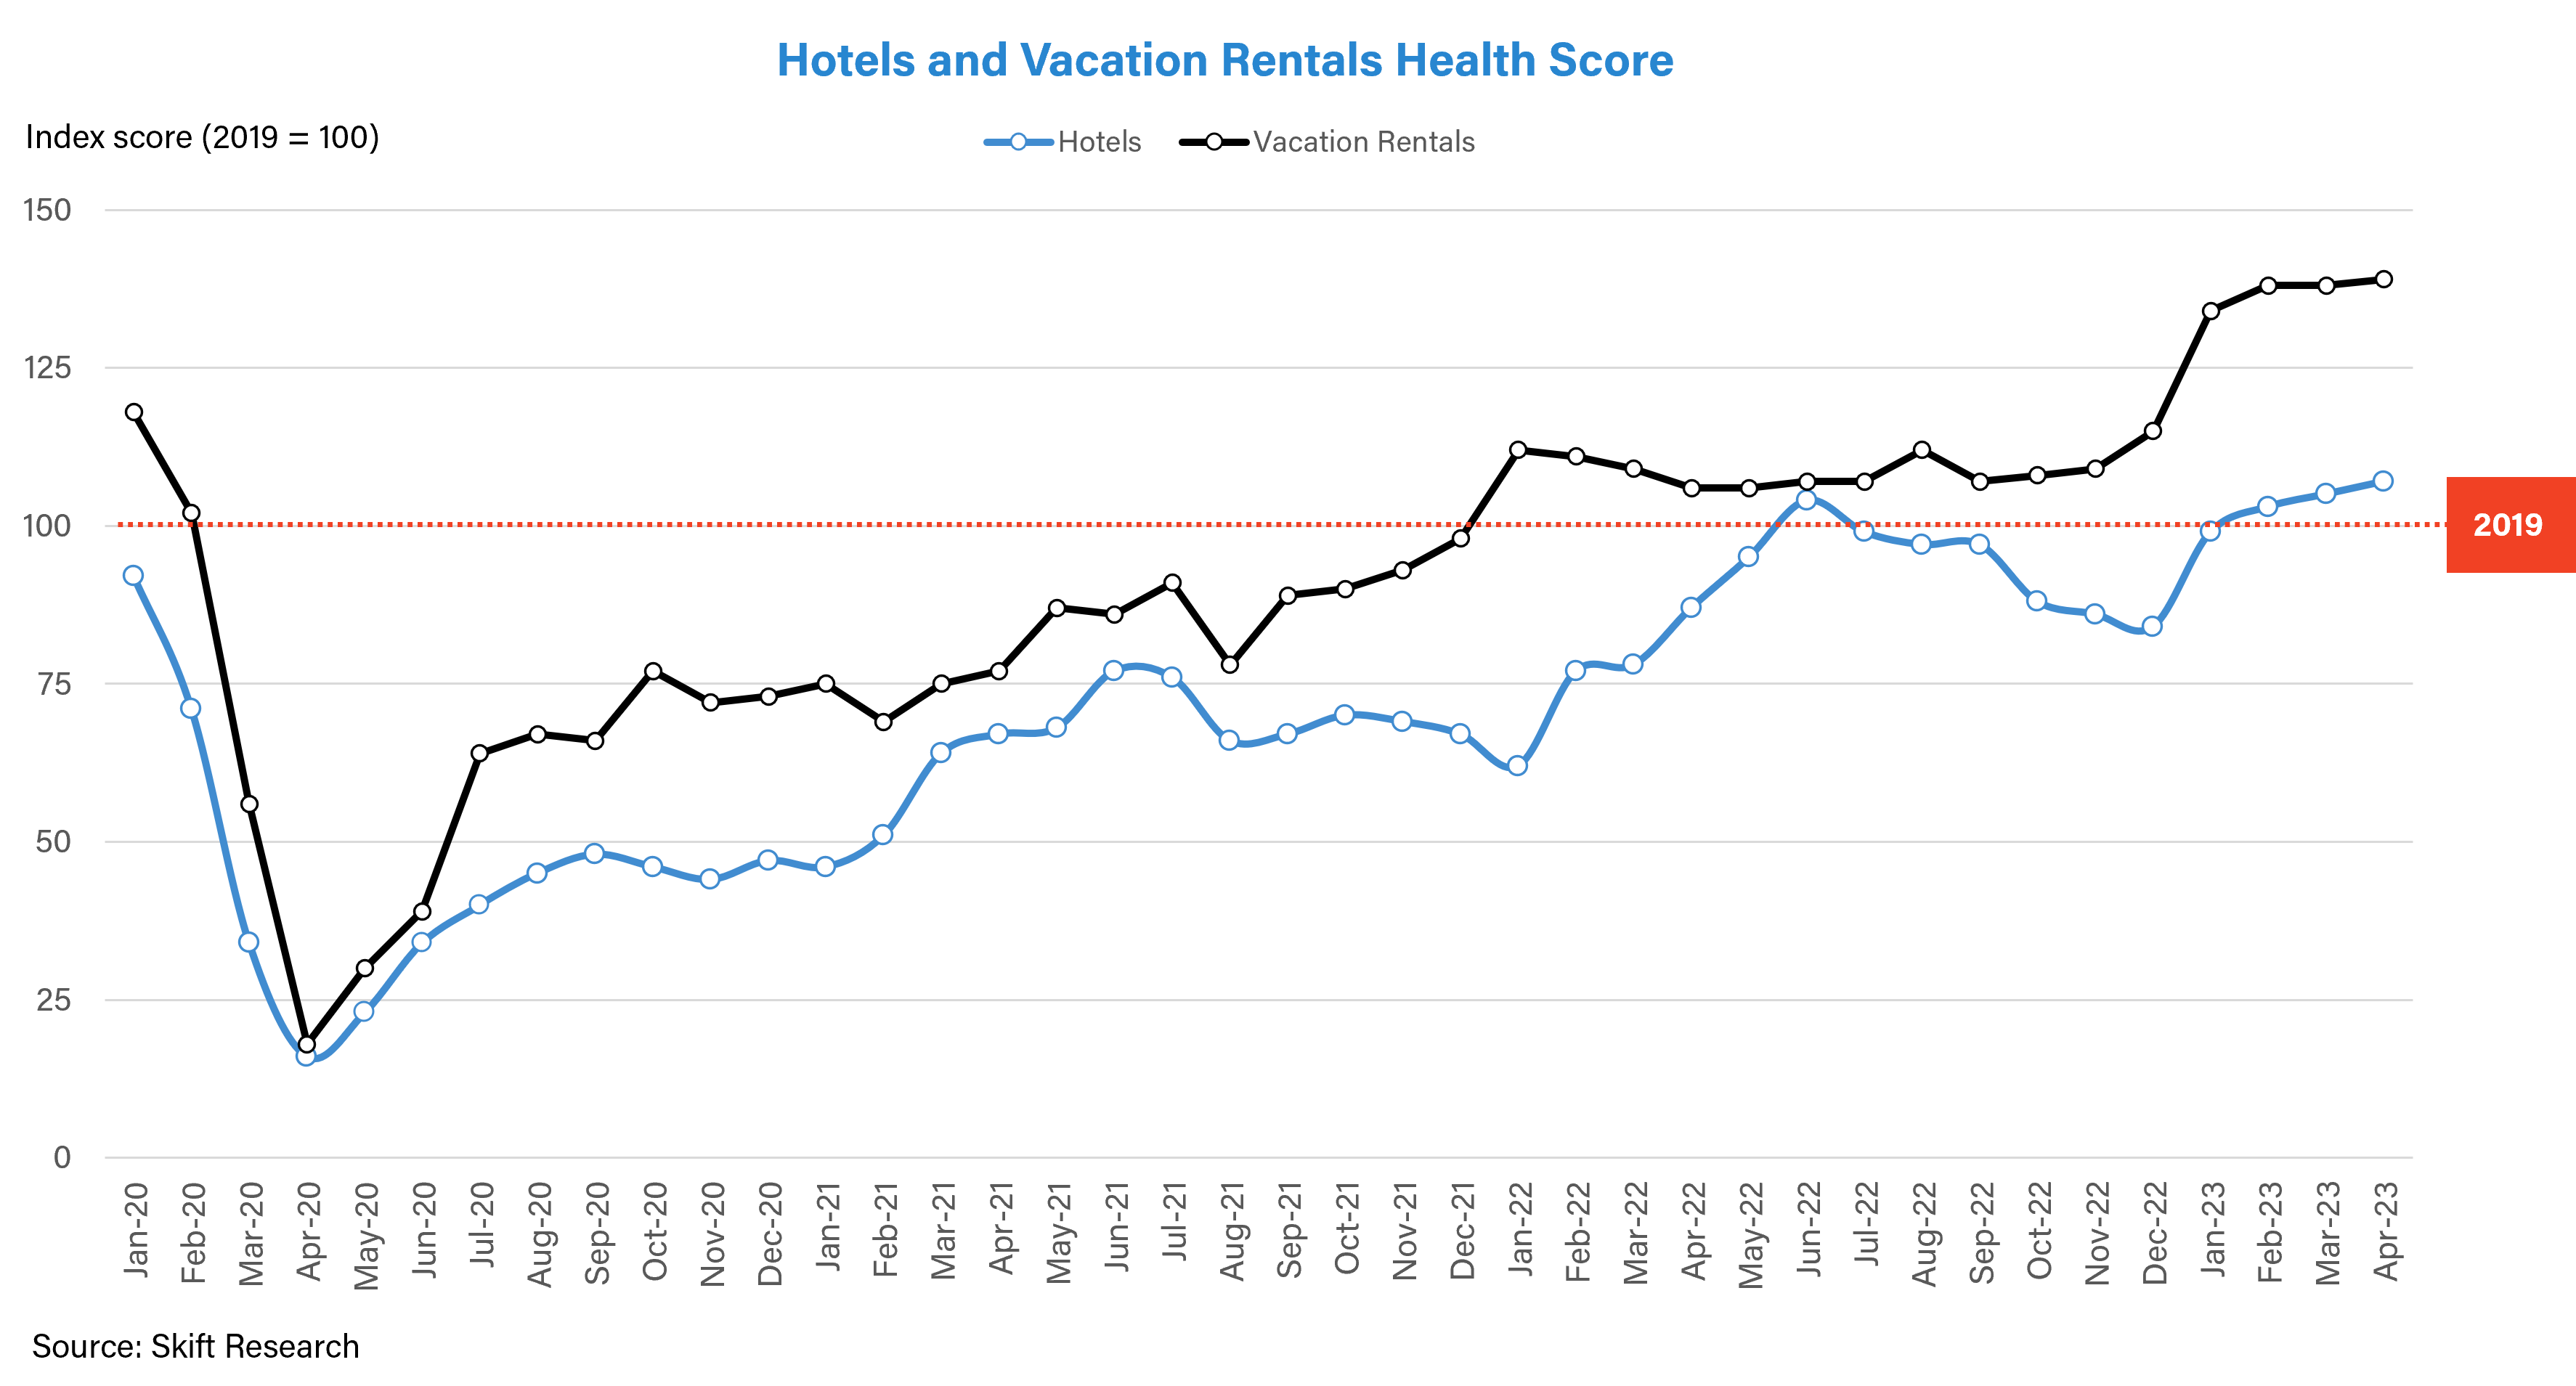
Looking at the accommodation sector, vacation rentals that gained popularity through the pandemic have recovered faster than hotels. The vacation rental sector index initially surpassed 2019 performance in January 2022 by 12 percentage points, and it has since risen above pre-pandemic levels. Since January 2023, vacation rentals have been 30-40 percentage points above 2019 performance levels.
Strong Pricing Fuels Recovery
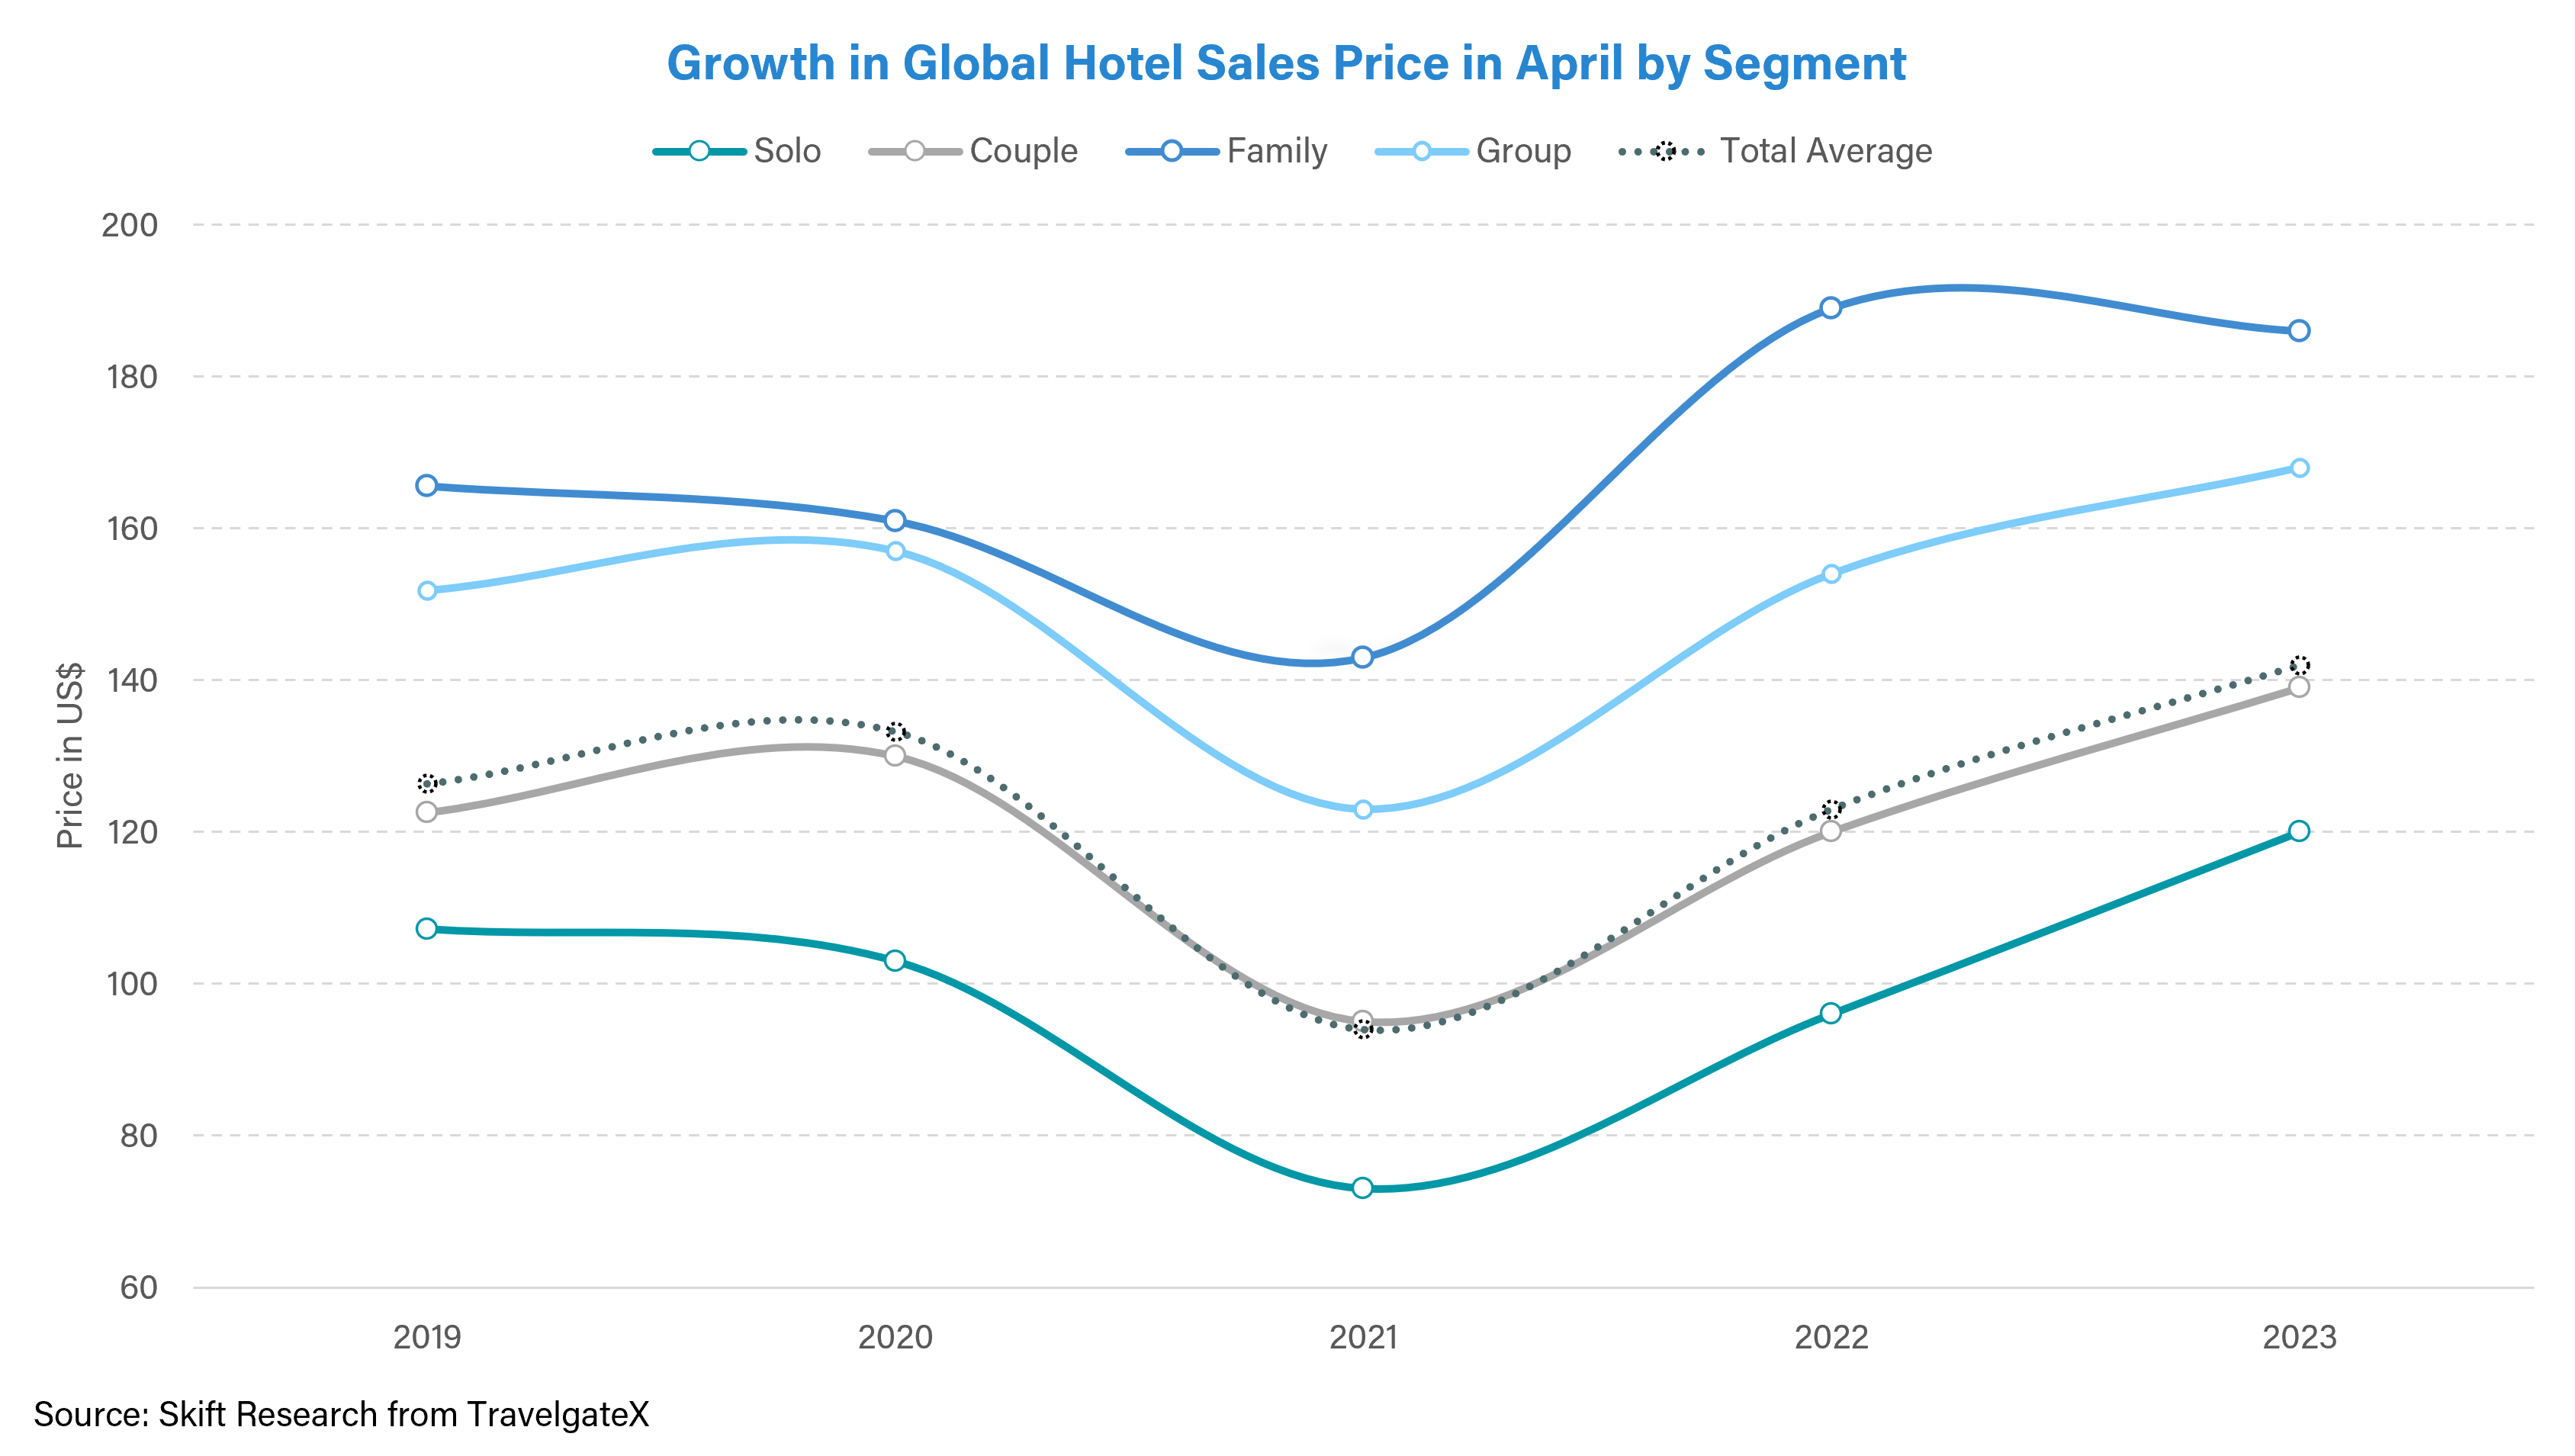
High prices have fueled the recovery even though travel volumes have not fully recovered. The average transaction value for hotel stays has increased 13 percent globally compared to 2019 levels.
Compared to pre-pandemic, the Groups and Family segments have performed above average. Significant growth was seen in the Family segment, which is now up 12 percent from April 2019 levels. According to data from TravelgateX, even the Solo segment, which appears to be the most price-sensitive, increased by 12 percent from 2019 levels.
Regional Gains Across the Board
All regions covered by the Skift Travel Health Index grew month-on-month, although not all have fully recovered.
Skift Travel Health Index Performance by Region
| Region | Sep-22 | Oct-22 | Nov-22 | Dec-22 | Jan-23 | Feb-23 | Mar-23 | Apr-23 | MoM Growth (abs) |
|---|---|---|---|---|---|---|---|---|---|
| Asia Pacific | 72 | 70 | 71 | 72 | 85 | 96 | 100 | 103 | +3 |
| Europe | 92 | 89 | 90 | 93 | 98 | 95 | 96 | 98 | +2 |
| Latin America | 106 | 100 | 103 | 105 | 110 | 108 | 111 | 113 | +2 |
| Middle East and Africa | 97 | 96 | 94 | 93 | 98 | 102 | 100 | 102 | +2 |
| North America | 104 | 102 | 103 | 103 | 101 | 100 | 96 | 97 | +1 |
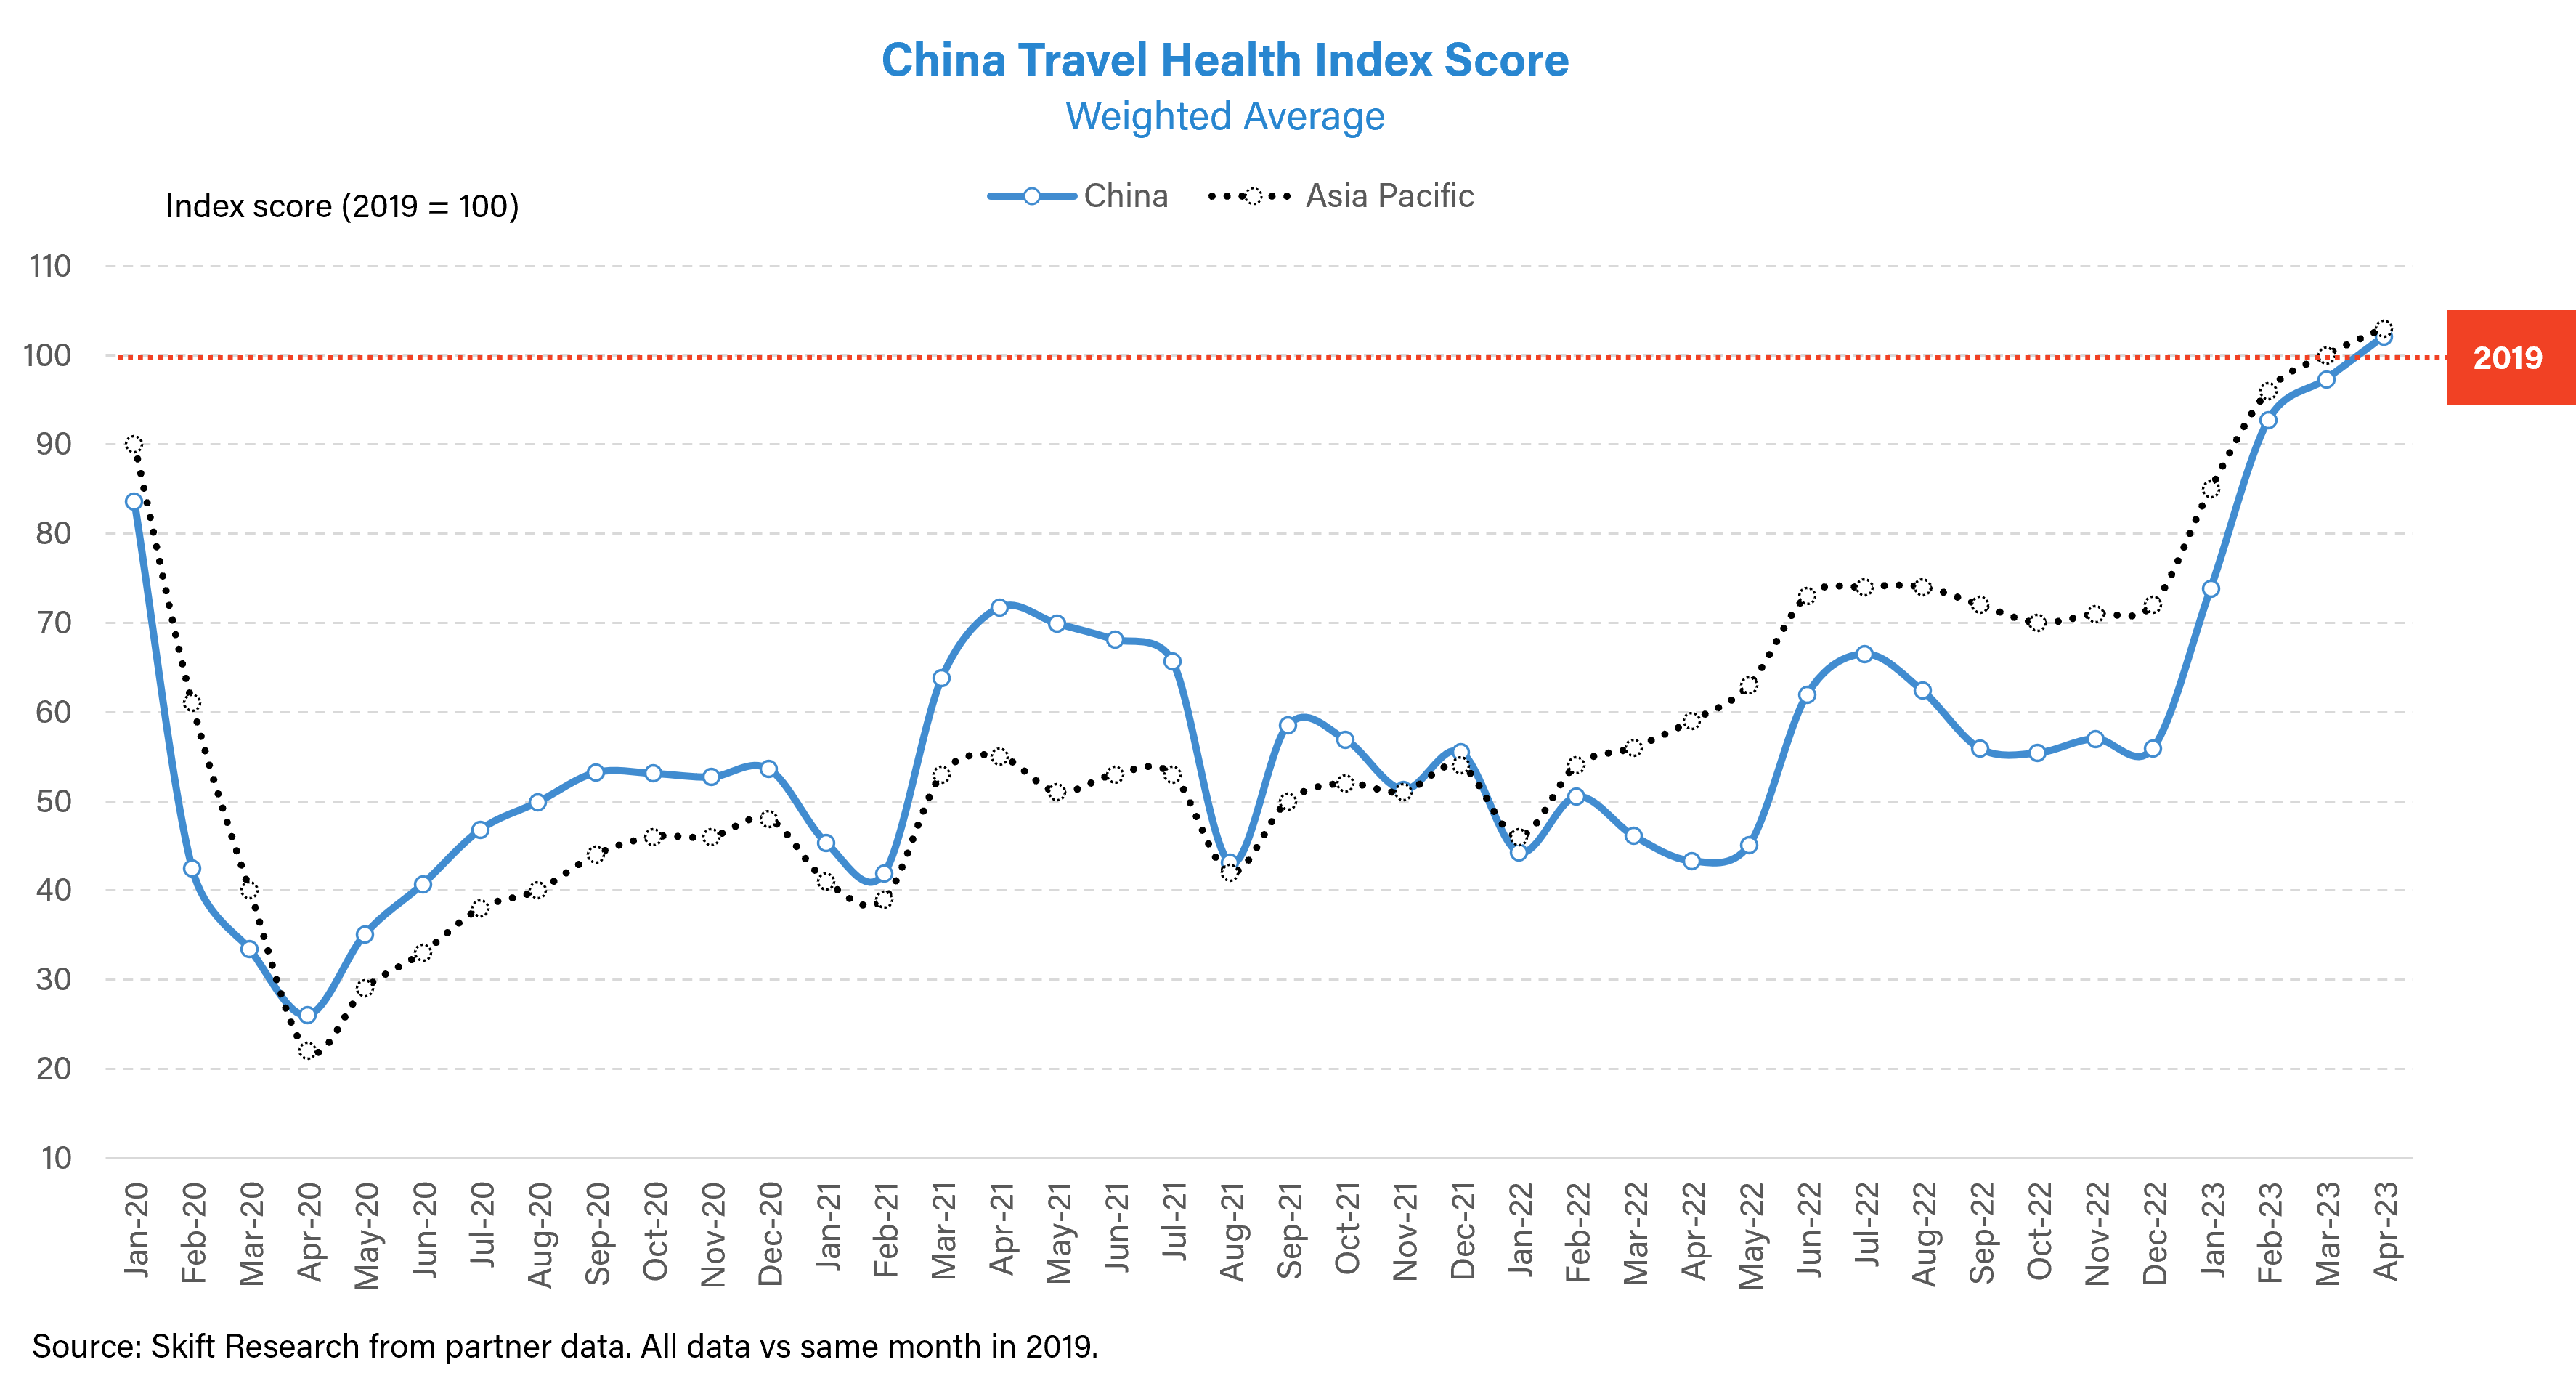
Asia Pacific had the highest month-over-month growth. The region’s long-term struggle eased once China reopened for travel. China’s travel health has been crucial to the Asia Pacific’s revival. This is evident from the sharp uptick in the region’s performance following China’s comeback January 2023 onwards.
Travel Performance in Some Countries is Still Lagging
As of April 2023, 13 out of 22 countries tracked have surpassed 2019 levels thus driving the aggregated global index above 100. While Hong Kong and Russia’s recovery rates of 77% and 63%, respectively, have been dragging the index down, the other countries’ strong performance has been able to make up for it.
France and Argentina made it to the top of the chart this month based on month-on-month growth.
According to Daily Lodging Report, during the “Golden Week” domestic travel in China generated $21.4 billion, topping 101% of pre-Covid levels. The “May Day” holiday which ran from 29th April to 3rd May this year saw occupancy indexed at 97% of the pre-pandemic holiday. China has embarked on a successful journey to normalcy. While domestic demand in China boomed, a large number of Chinese citizens made outbound trips too. Countries such as Hong Kong and Macau benefited the most with hotel occupancy reaching almost 90% during the period. Other countries such as Indonesia, Singapore, South Korea and Thailand likely welcomed Chinese travelers as well.
Travel recovery in Russia continues to be sluggish, although it is 13 pp higher than the same time last year.
Skift Travel Health Index Performance by Country
| Country | Apr-23 | Mar-23 | MoM Growth (abs) | YoY Growth (abs) |
|---|---|---|---|---|
| France | 110.0 | 102.5 | +8 | +12 |
| Argentina | 109.9 | 103.3 | +7 | +11 |
| Thailand | 105.3 | 99.7 | +6 | +34 |
| Hong Kong, China | 77.1 | 71.7 | +5 | +45 |
| China | 102.1 | 97.3 | +5 | +59 |
| United Arab Emirates | 109.6 | 105.3 | +4 | +7 |
| Turkey | 107.8 | 104.7 | +3 | +8 |
| Germany | 92.6 | 89.7 | +3 | +11 |
| Indonesia | 91.2 | 88.6 | +3 | +19 |
| Brazil | 112.3 | 110.1 | +2 | +4 |
| Canada | 98.8 | 96.6 | +2 | +7 |
| United Kingdom | 103.4 | 102.0 | +1 | +8 |
| U.S. | 96.9 | 96.5 | 0 | -7 |
| Spain | 104.2 | 103.9 | 0 | +11 |
| India | 110.9 | 111.1 | 0 | +15 |
| Singapore | 102.4 | 103.1 | -1 | +24 |
| Japan | 108.3 | 109.4 | -1 | +61 |
| South Africa | 91.6 | 93.3 | -2 | +14 |
| Australia | 95.6 | 98.4 | -3 | +2 |
| Italy | 99.0 | 102.1 | -3 | +4 |
| Russia | 62.6 | 65.9 | -3 | +13 |
| Mexico | 117.4 | 120.8 | -3 | +7 |
China Aids Hong Kong’s Travel Recovery
While Hong Kong is still at 77% recovery, the country achieved a 5 pp increase over the previous month and a 45 pp increase over April 2022. As of 2019, China was the largest inbound market for Hong Kong accounting for 78% of international arrivals which is 55.9 million travelers. The reopening of China provided momentum to tourism in Hong Kong.
The country has grown its airline seat capacity since re-opening for tourists to 1.9 million per month as of April 2023. However, it is still 51% less than 2019 levels. Airline seat capacity is expected to grow in the upcoming months.

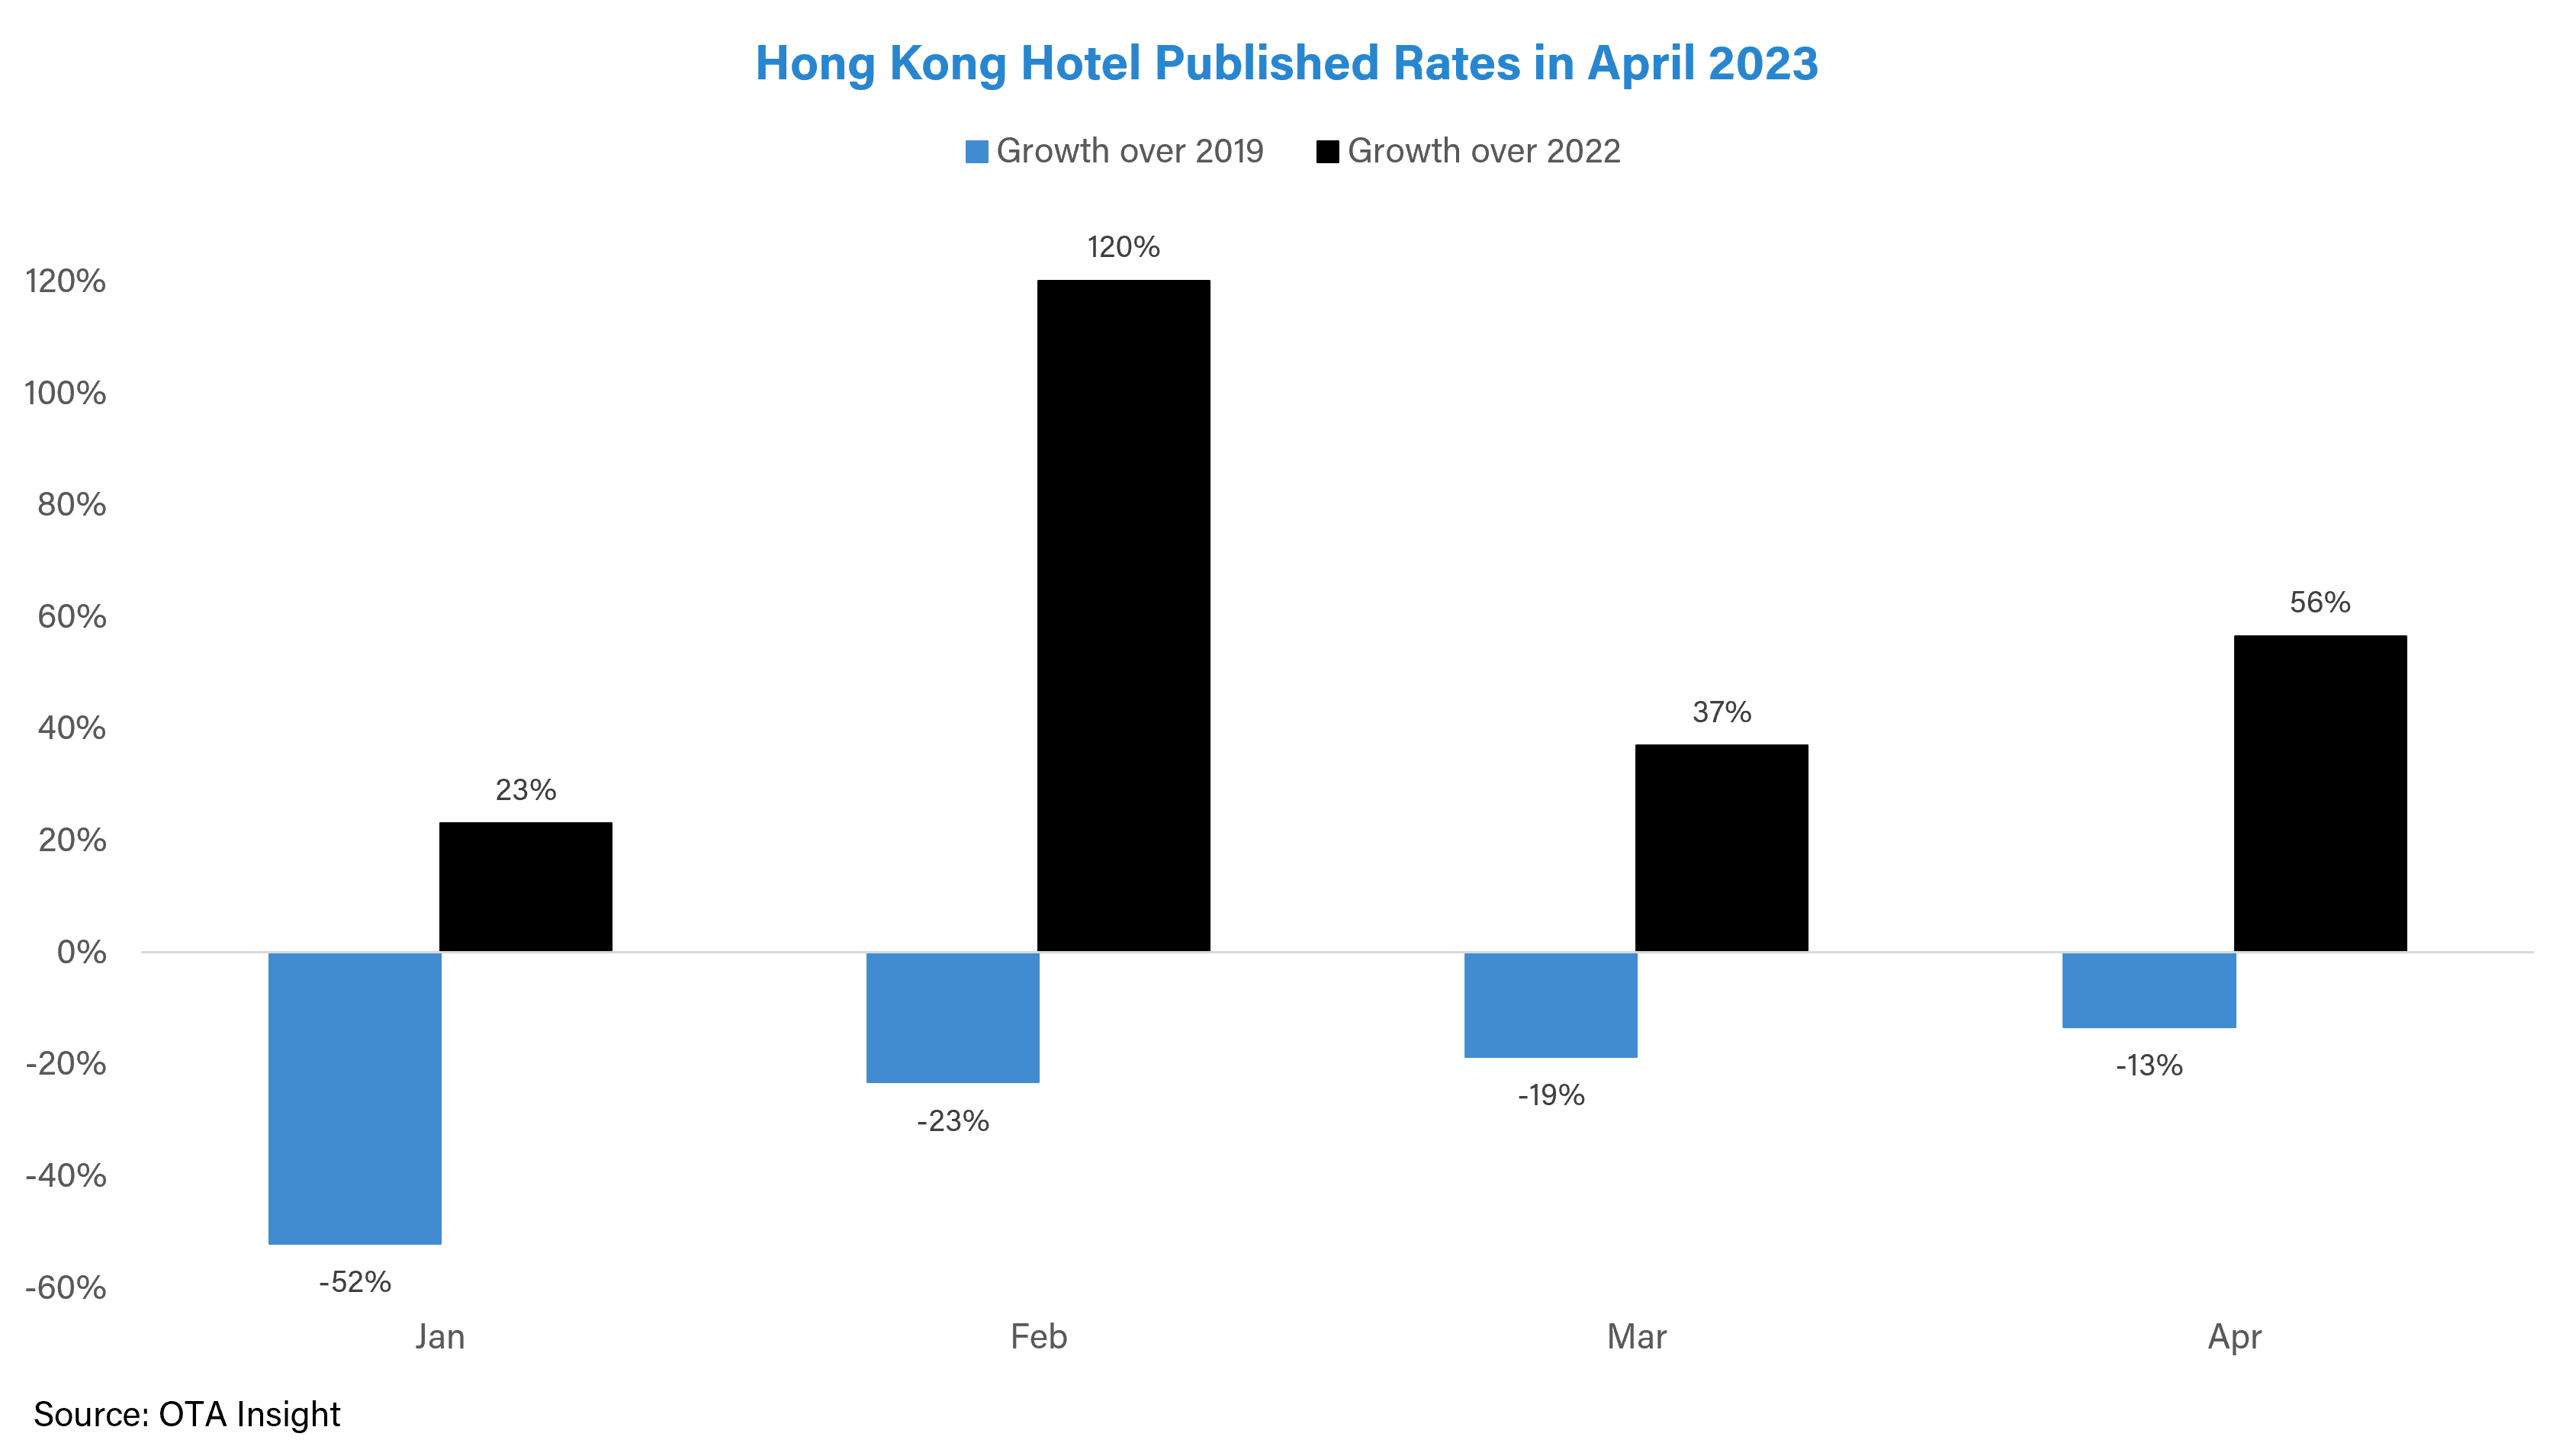
Daily Lodging Report reported a surge in hotel rates in Hong Kong ahead of the Labor Day Holiday. Meanwhile, OTA Insight data shows that hotel rates have not yet caught up to those of 2019, but the difference appears to be shrinking.
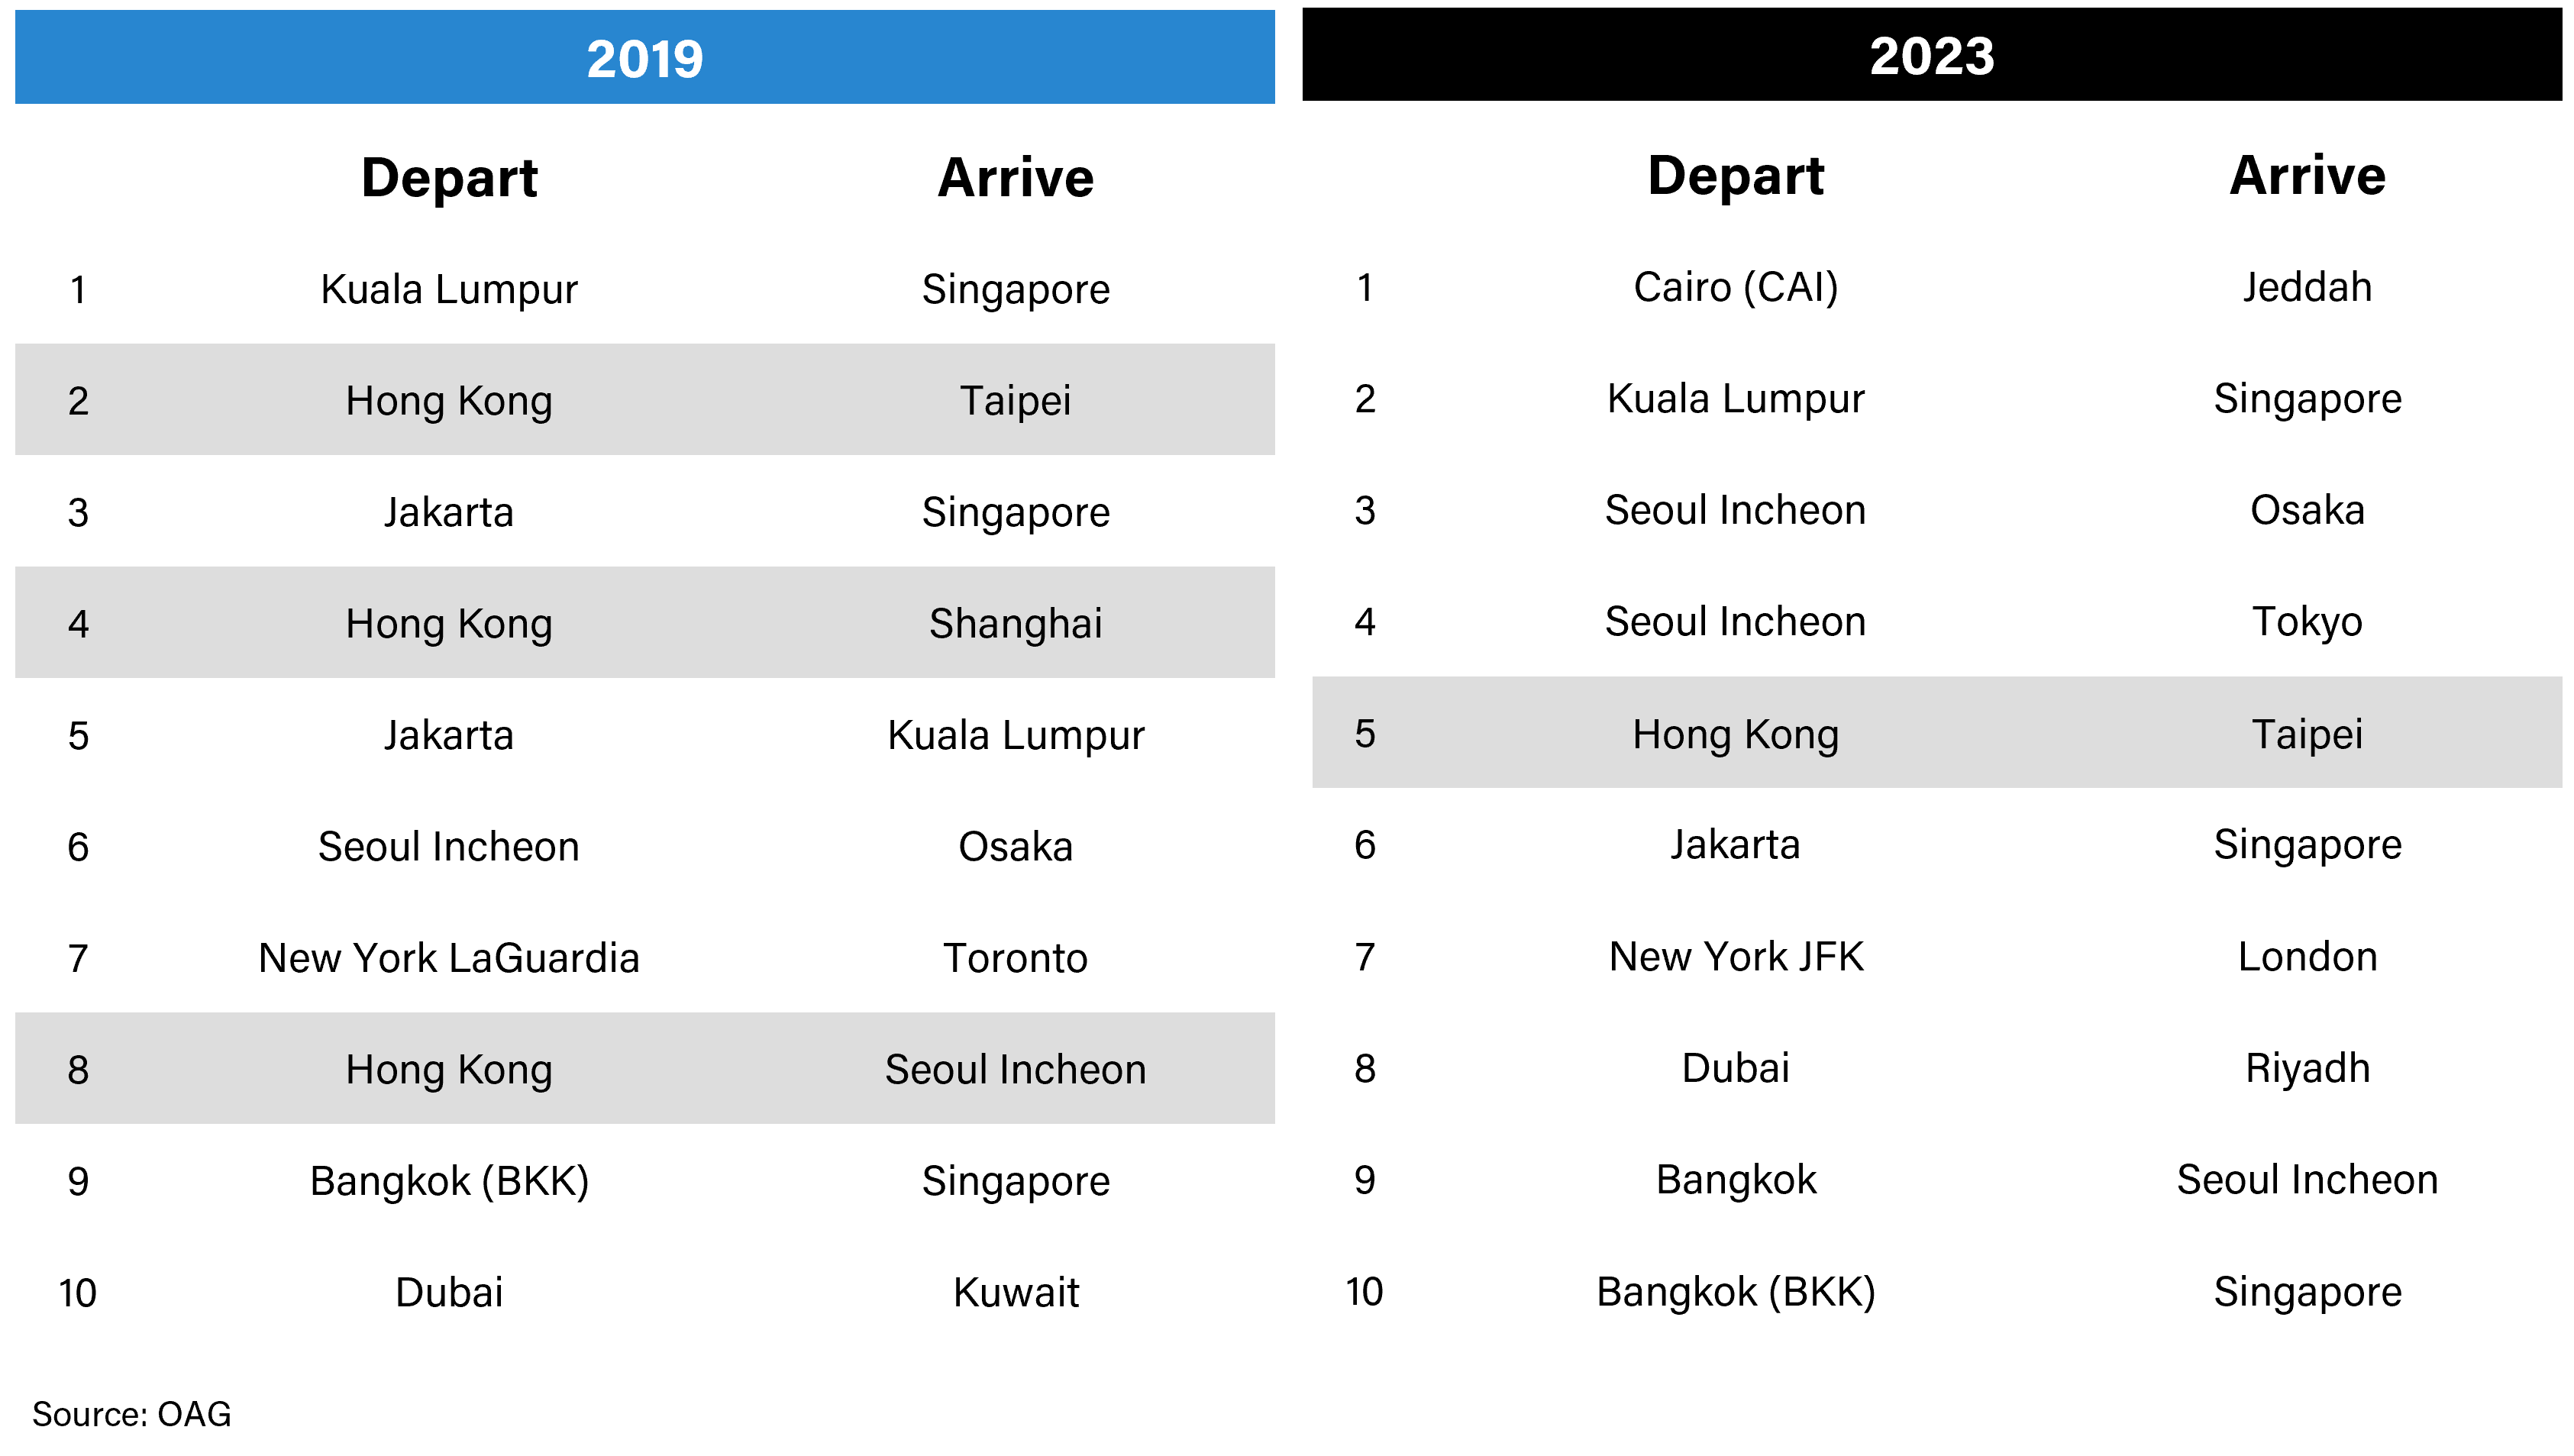
International travel from Hong Kong too seems to be fairly muted. As of May 2023, only the Hong Kong – Taipei route made it to the top 10 list of busiest international airline routes.
Busiest International Airline Routes
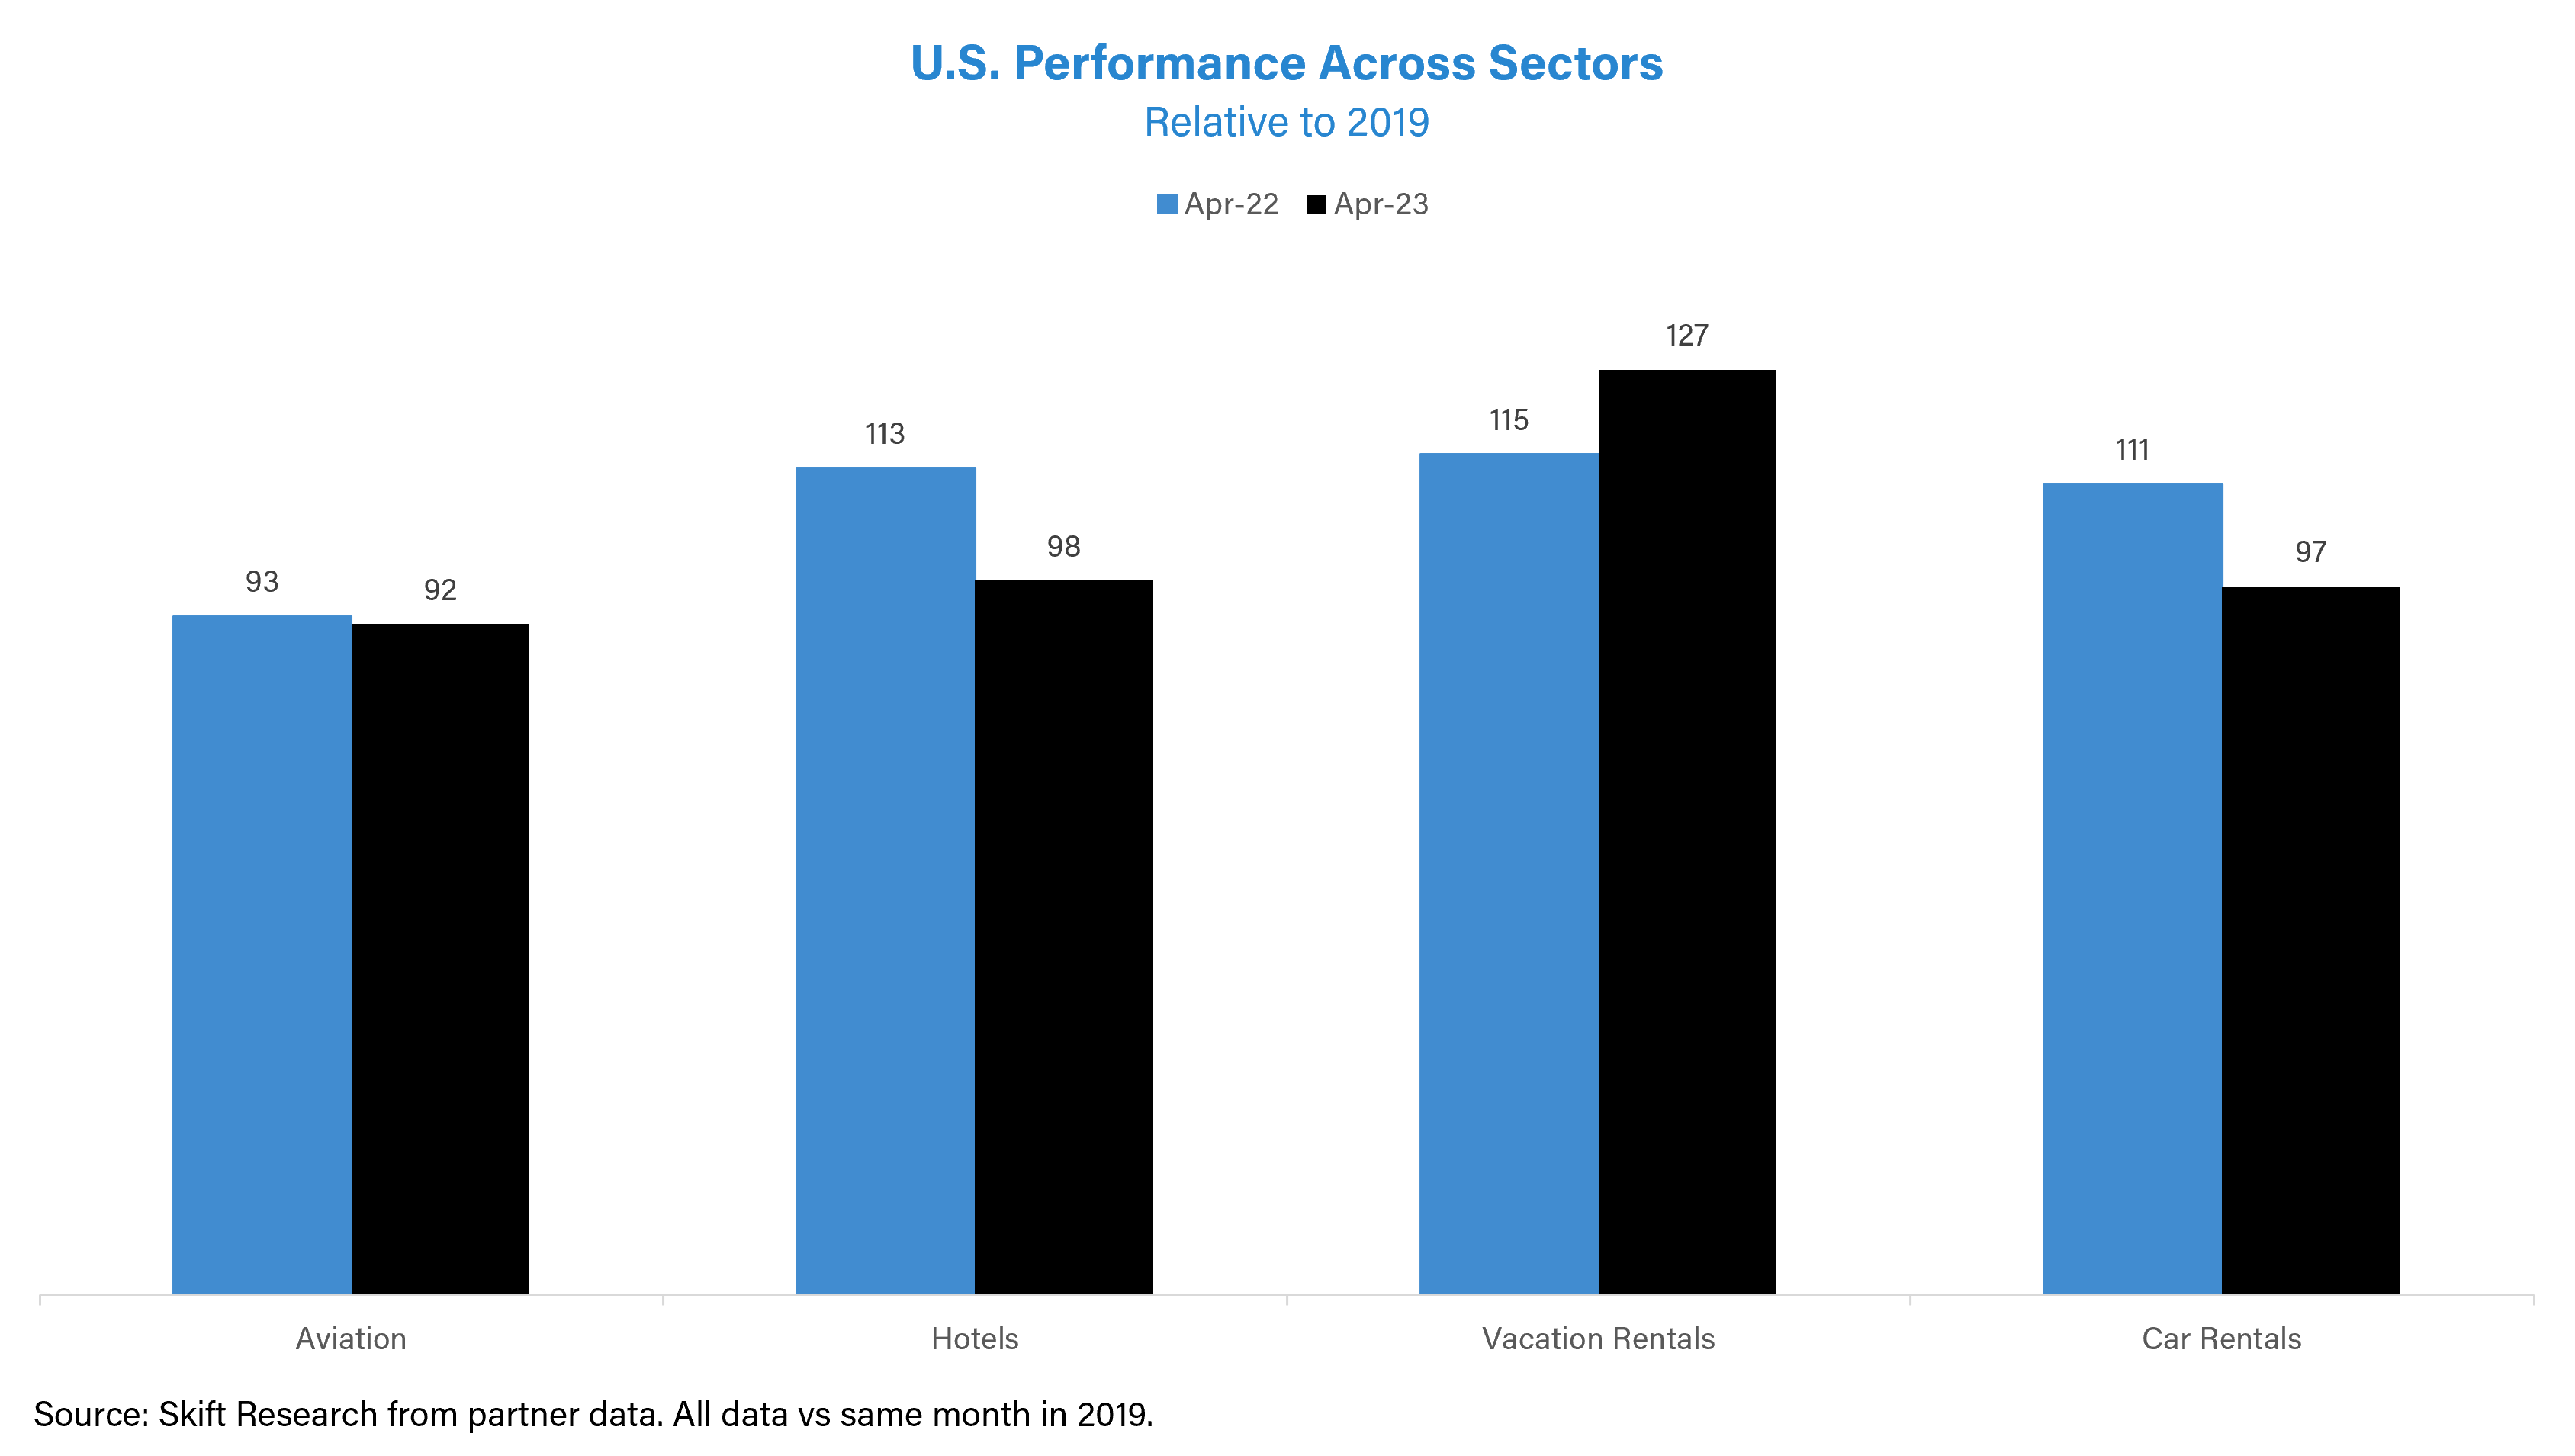
U.S. Performance Has Slowed
Although the U.S. maintained consistent month-over-month performance, it was the only country to experience a year-over-year fall. This could be a result of the uncertainty surrounding the U.S. economy. According to Skift’s U.S. Travel Tracker, 30% of U.S. citizens polled in March 2023 predict the economy would worsen in the next 12 months. This represents a rise from 24% in January 2023.

Performance across all sectors except Vacation Rentals declined over 2022. Hotels and car rentals declined 15 and 14 pp respectively over last year.
The U.S. Travel Tracker survey shows that hotels have remained the preferred type of accommodation since 2020, with 46% of respondents reporting that they prefer to stay in hotels as of March 2023. Although the share of travelers opting for vacation rentals increased from 4% in the first quarter of 2020 to 12% in the first quarter of 2023, it remains much lower in contrast to those who choose to stay in hotels.
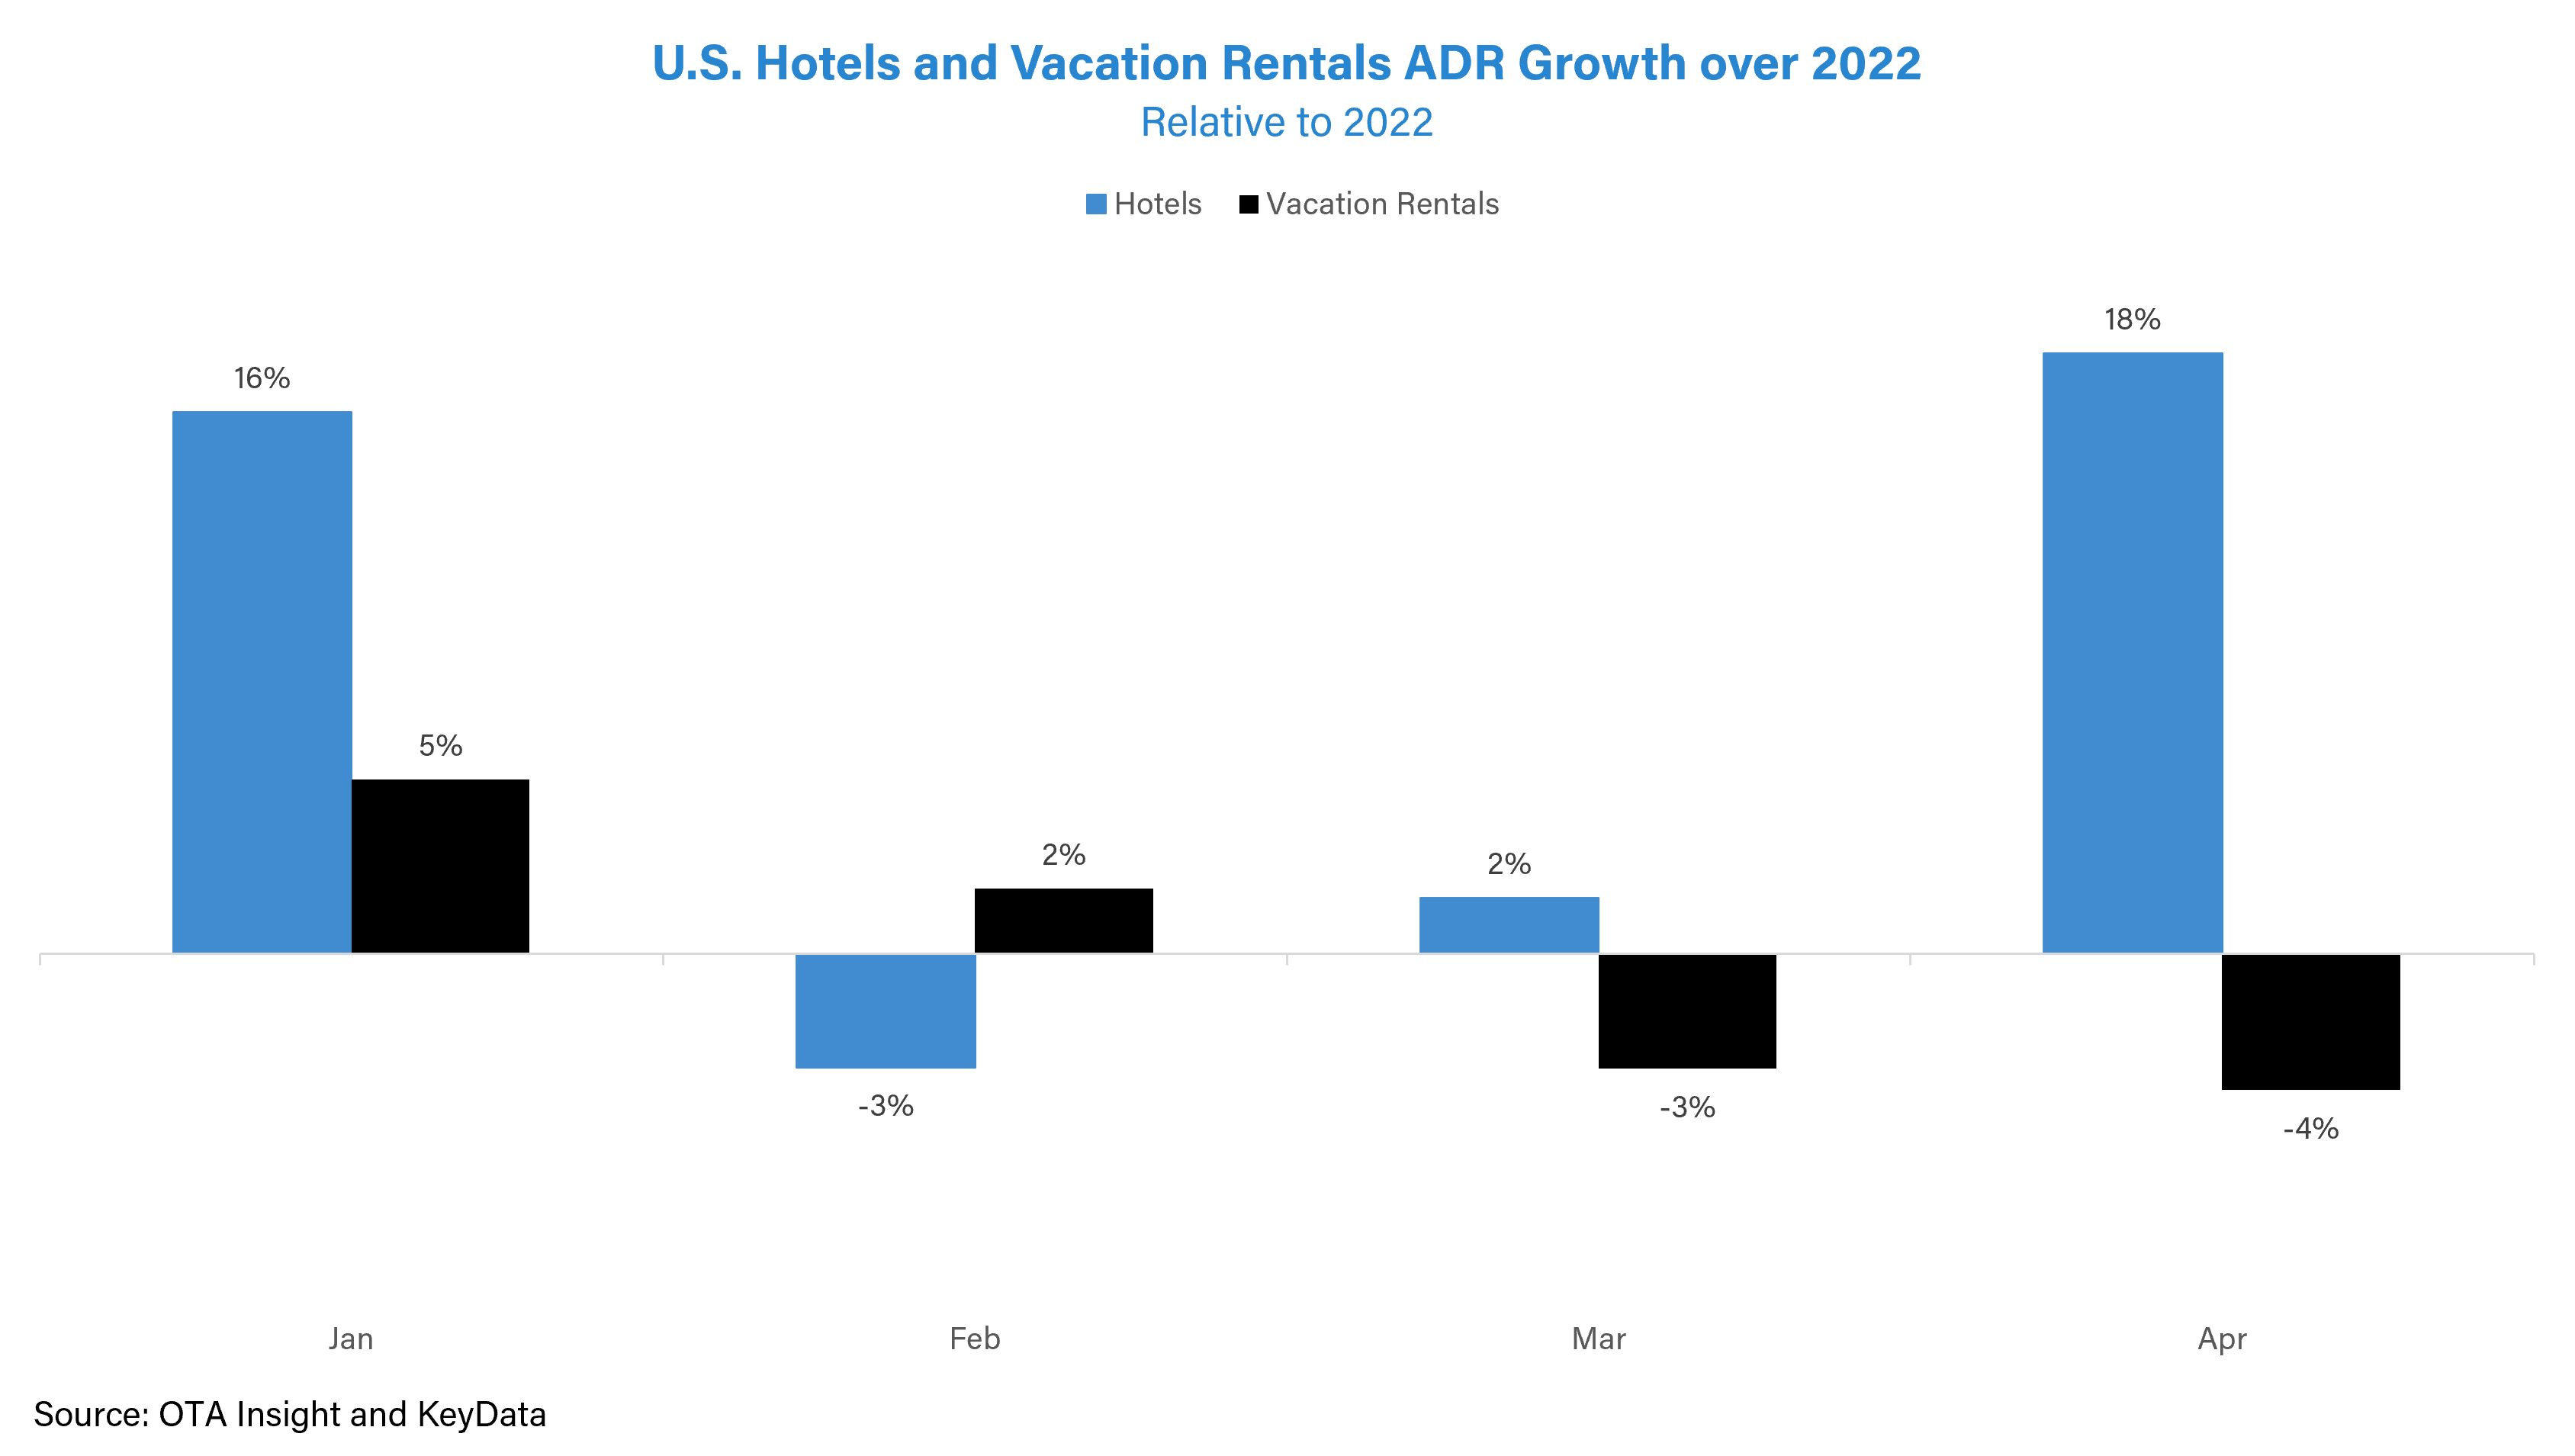
The hotel sector index, however, has declined this year. This slump could be attributed to high pricing since published hotel rates have risen faster than vacation rental rates this year. This is also interesting since the boom of vacation rentals is likely softening now and hoteliers who were previously conservative can still raise prices. Vacation rentals on the other hand have now recognized the need to reduce pricing over last year.
Conclusion
The travel industry received a boost in April 2023 and overtook 2019 performance levels. All sectors covered like Aviation, Hotels, Vacation Rentals, and Car Rentals witnessed month-on-month growth and are at an all-time high this month.
Most countries have either surpassed 2019 levels or have almost recovered. Hong Kong, aided by growing Chinese travel witnessed growth this month. The influence of economic worry in the U.S. appears to have had an effect on travel performance. While the U.S. maintained a 97% recovery, it fell 7 pp from last year.
Methodology
Data Partners
Skift Research collects and analyzes data from 22 different data partners, to provide the most comprehensive view of the travel industry’s performance.
Index Design
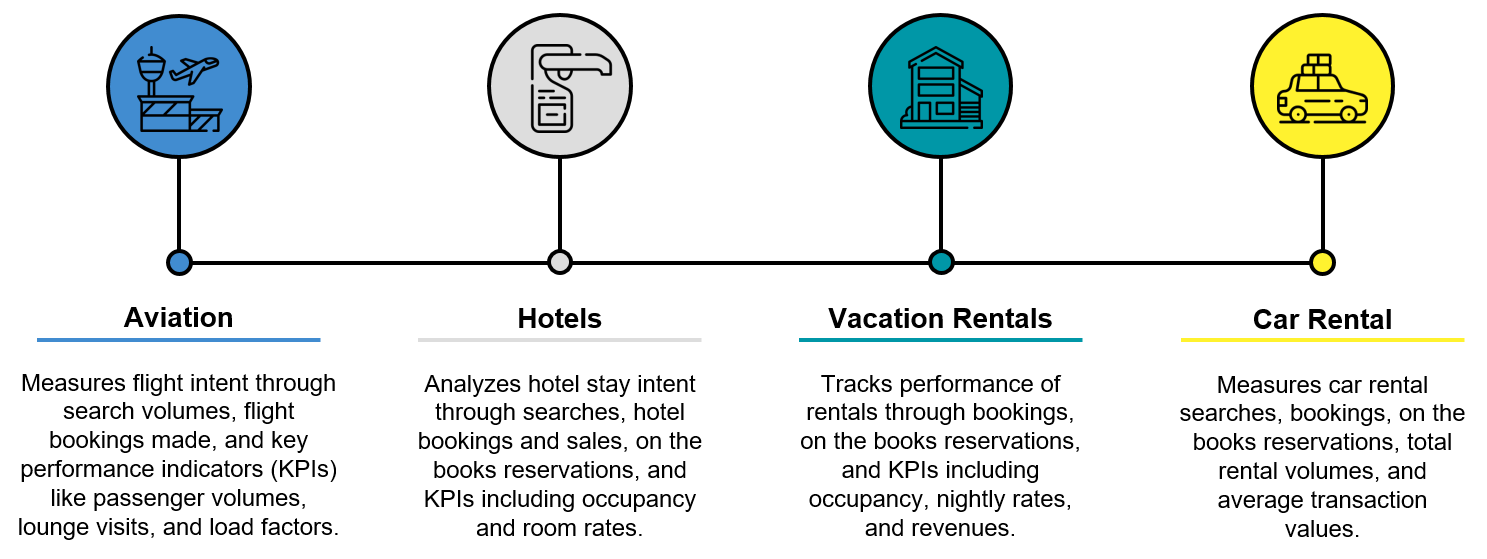
The Index tracks 84 indicators per country to assess the health of the travel industry in each country. These indicators are aggregated into performance categories and sub-categories. The top level of division is by travel vertical, and each vertical is further divided by intent indicators, booking indicators, and key performance indicators.
The Index covers the following travel sectors:
Country Coverage
The Index focuses on the travel performance in 22 of the largest tourism economies, combined accounting for 62% of inbound tourism receipts, 67% of outbound tourism expenditure, and 78% of global 2019 GDP.
– Argentina
– Australia
– Brazil
– Canada
– China
– France
– Germany
– Hong Kong, China
– India
– Indonesia
– Italy
– Japan
– Mexico
– Russia
– Singapore
– South Africa
– Spain
– Thailand
– Turkey
– U.S.
– United Arab Emirates
– United Kingdom
Index Score Calculation
The Index is designed to provide an easy overview of the health of the travel industry. We have tracked the industry since the beginning of 2020. For 2020, 2021, 2022, and 2023 data, the performance of each indicator is compared to the same time in 2019. The Index provides a score relative to a baseline reading of 100 for the same month in 2019.
The full methodology can be found on our website.
Data Tables
Total Skift Travel Health Index Scores by Country
| Sep 2022 | Oct 2022 | Nov 2022 | Dec 2022 | Jan 2023 | Feb 2023 | Mar 2023 | Apr 2023 | |
|---|---|---|---|---|---|---|---|---|
| Argentina | 110.5 | 94.9 | 90.5 | 92.4 | 96.6 | 95.0 | 103.3 | 109.9 |
| Australia | 98.1 | 94.4 | 93.1 | 99.4 | 108.8 | 98.9 | 98.4 | 95.6 |
| Brazil | 100.5 | 97.2 | 103.5 | 104.4 | 111.2 | 107.7 | 110.1 | 112.3 |
| Canada | 99.1 | 97.1 | 95.4 | 96.7 | 94.1 | 97.5 | 96.6 | 98.8 |
| China | 55.9 | 55.4 | 57.0 | 55.9 | 73.8 | 92.7 | 97.3 | 102.1 |
| France | 97.1 | 94.0 | 95.9 | 99.9 | 109.4 | 105.7 | 102.5 | 110.0 |
| Germany | 86.7 | 80.8 | 82.6 | 85.4 | 89.5 | 88.5 | 89.7 | 92.6 |
| Hong Kong, China | 53.4 | 55.6 | 55.6 | 68.5 | 56.8 | 74.3 | 71.7 | 77.1 |
| India | 106.5 | 96.9 | 98.2 | 100.4 | 100.1 | 106.1 | 111.1 | 110.9 |
| Indonesia | 80.2 | 81.5 | 80.6 | 82.2 | 91.0 | 93.6 | 88.6 | 91.2 |
| Italy | 100.7 | 95.7 | 94.8 | 102.9 | 101.2 | 98.5 | 102.1 | 99.0 |
| Japan | 71.2 | 77.5 | 73.2 | 78.8 | 102.4 | 103.7 | 109.4 | 108.3 |
| Mexico | 114.1 | 111.0 | 114.3 | 119.0 | 121.0 | 120.5 | 120.8 | 117.4 |
| Russia | 57.5 | 52.4 | 51.1 | 54.1 | 68.4 | 67.6 | 65.9 | 62.6 |
| Singapore | 88.6 | 85.1 | 87.1 | 83.2 | 90.9 | 94.5 | 103.1 | 102.4 |
| South Africa | 86.9 | 80.2 | 81.9 | 77.3 | 90.9 | 93.5 | 93.3 | 91.6 |
| Spain | 94.2 | 94.9 | 99.2 | 103.9 | 102.7 | 103.4 | 103.9 | 104.2 |
| Thailand | 79.2 | 77.9 | 79.2 | 90.1 | 97.1 | 99.1 | 99.7 | 105.3 |
| Turkey | 112.2 | 113.8 | 108.8 | 103.4 | 113.9 | 89.7 | 104.7 | 107.8 |
| U.S. | 104.5 | 102.7 | 104.4 | 103.9 | 102.0 | 100.6 | 96.5 | 96.9 |
| United Arab Emirates | 104.8 | 107.8 | 102.9 | 104.7 | 103.5 | 108.9 | 105.3 | 109.6 |
| United Kingdom | 98.4 | 97.6 | 97.8 | 98.5 | 102.4 | 101.3 | 102.0 | 103.4 |
Aviation Scores by Country
| Sep 2022 | Oct 2022 | Nov 2022 | Dec 2022 | Jan 2023 | Feb 2023 | Mar 2023 | Apr 2023 | |
|---|---|---|---|---|---|---|---|---|
| Argentina | 85.1 | 80.2 | 78.8 | 83.7 | 83.2 | 82.2 | 87.4 | 98.5 |
| Australia | 88.6 | 89.9 | 90.4 | 94 | 92.6 | 101.8 | 103.6 | 95.1 |
| Brazil | 90.7 | 89.2 | 93.5 | 92.2 | 104.4 | 99.7 | 103.2 | 110.7 |
| Canada | 83.1 | 83.7 | 84.8 | 87.2 | 76.2 | 89.4 | 89.7 | 88.4 |
| China | 30.3 | 28.2 | 36.1 | 45 | 42.0 | 57.2 | 59.1 | 61.4 |
| France | 82.9 | 82.2 | 83.9 | 86.4 | 99.0 | 96.9 | 98.4 | 105.7 |
| Germany | 72.8 | 71.3 | 71.1 | 76.6 | 90.8 | 87.8 | 90.3 | 91.9 |
| Hong Kong, China | 24.3 | 29.2 | 34.1 | 46 | 35.9 | 50.7 | 51.5 | 54.8 |
| India | 98 | 92.7 | 104.4 | 111 | 101.7 | 103.4 | 105.6 | 104.1 |
| Indonesia | 55.9 | 54.9 | 55.1 | 57.6 | 67.9 | 67.9 | 62.1 | 65.2 |
| Italy | 100.4 | 98.5 | 95 | 108.3 | 113.8 | 106.0 | 110.2 | 100.0 |
| Japan | 57.3 | 61.7 | 65.6 | 73.6 | 88.1 | 87.8 | 94.2 | 91.4 |
| Mexico | 101.9 | 101.6 | 102.8 | 105.5 | 107.9 | 111.3 | 111.8 | 111.5 |
| Russia | 77.9 | 65.3 | 67.7 | 67.2 | 77.9 | 74.2 | 73.6 | 69.9 |
| Singapore | 63.6 | 58.8 | 60 | 61.1 | 71.7 | 77.1 | 75.3 | 76.3 |
| South Africa | 72.5 | 62.2 | 61.6 | 64.2 | 78.6 | 75.8 | 73.8 | 73.9 |
| Spain | 95.3 | 83.2 | 90.3 | 87.1 | 116.2 | 115.6 | 114.1 | 111.1 |
| Thailand | 67 | 66.6 | 71 | 76 | 80.9 | 82.1 | 79.7 | 84.8 |
| Turkey | 108 | 86.5 | 89.3 | 87.8 | 106.6 | 94.1 | 92.9 | 104.6 |
| U.S. | 96.3 | 85.1 | 85.4 | 86.2 | 94.1 | 94.9 | 90.8 | 91.9 |
| United Arab Emirates | 89.4 | 84.6 | 80.8 | 84.3 | 96.9 | 101.8 | 97.3 | 96.2 |
| United Kingdom | 84.2 | 73.2 | 76.4 | 77.8 | 90.9 | 91.3 | 94.0 | 92.7 |
Aviation contributes 40% to the total score. The scores in this table have been indexed to give a better insight into performance. 100 = pre-pandemic level.
Hotel Scores by Country
| Sep 2022 | Oct 2022 | Nov 2022 | Dec 2022 | Jan 2023 | Feb 2023 | Mar 2023 | Apr 2023 | |
|---|---|---|---|---|---|---|---|---|
| Argentina | 146.1 | 112 | 100.2 | 102.5 | 114.6 | 113.7 | 125.1 | 125.1 |
| Australia | 103.6 | 91.6 | 96.9 | 95.7 | 123.1 | 88.2 | 84.6 | 82.0 |
| Brazil | 118.8 | 111.1 | 121.9 | 123.1 | 126.6 | 129.2 | 140.6 | 133.0 |
| Canada | 124.2 | 109.8 | 111.3 | 107.6 | 99.6 | 94.8 | 94.8 | 102.3 |
| China | 72.8 | 58.5 | 55.3 | 47.8 | 91.1 | 107.2 | 108.3 | 112.1 |
| France | 114.2 | 103.7 | 106.6 | 115.1 | 115.2 | 108.4 | 106.3 | 108.3 |
| Germany | 105.9 | 91.7 | 94.2 | 89.4 | 88.5 | 91.6 | 96.4 | 98.6 |
| Hong Kong, China | 59.9 | 58.8 | 56.8 | 74 | 59.7 | 83.3 | 75.1 | 88.2 |
| India | 122.8 | 97.3 | 89.9 | 89.8 | 95.6 | 104.9 | 117.3 | 118.6 |
| Indonesia | 98 | 98.4 | 95.9 | 100.2 | 111.1 | 113.6 | 108.2 | 112.6 |
| Italy | 109.8 | 101.3 | 98.9 | 96.4 | 92.5 | 93.7 | 95.9 | 98.2 |
| Japan | 90.8 | 94.2 | 81.6 | 82.6 | 124.1 | 120.5 | 123.4 | 123.2 |
| Mexico | 128.1 | 125.4 | 130.1 | 135.4 | 133.8 | 130.1 | 133.3 | 128.5 |
| Russia | 19.3 | 19.1 | 12.6 | 21.8 | 49.8 | 51.6 | 52.5 | 47.2 |
| Singapore | 104.8 | 96.8 | 109.2 | 86 | 99.6 | 108.9 | 129.4 | 134.8 |
| South Africa | 98.2 | 87.6 | 91.2 | 72.5 | 101.1 | 114.3 | 114.7 | 113.5 |
| Spain | 93.9 | 94.6 | 96.1 | 98.2 | 87.4 | 91.5 | 97.6 | 100.6 |
| Thailand | 87 | 87.5 | 86 | 106.4 | 117.7 | 109.8 | 123.6 | 135.1 |
| Turkey | 131.8 | 137.1 | 118.6 | 101.3 | 130.7 | 86.6 | 120.1 | 113.0 |
| U.S. | 108.9 | 104 | 107 | 103.8 | 101.0 | 100.3 | 97.8 | 97.9 |
| United Arab Emirates | 114.7 | 122.1 | 113.8 | 114.1 | 98.9 | 104.9 | 101.8 | 113.4 |
| United Kingdom | 105.5 | 103.8 | 104.7 | 100.3 | 104.8 | 104.5 | 105.6 | 110.8 |
Hotels contributes 35% to the total score. The scores in this table have been indexed to give a better insight into performance. 100 = pre-pandemic level.
Vacation Rental Scores by Country
| Sep 2022 | Oct 2022 | Nov 2022 | Dec 2022 | Jan 2023 | Feb 2023 | Mar 2023 | Apr 2023 | |
|---|---|---|---|---|---|---|---|---|
| Argentina | 139.1 | 144.1 | 143.8 | 139.1 | 144.9 | 144.4 | 143.5 | 148.0 |
| Australia | 138.2 | 137.4 | 103.0 | 141.0 | 139.3 | 136.0 | 137.9 | 141.5 |
| Brazil | 117.7 | 115.1 | 114.3 | 113.2 | 130.2 | 131.3 | 122.2 | 127.3 |
| Canada | 101.8 | 113.4 | 93.7 | 115.9 | 126.5 | 127.5 | 133.3 | 131.8 |
| China | 107.8 | 108.3 | 109.0 | 112.3 | 165.2 | 180.0 | 180.0 | 180.0 |
| France | 122.4 | 122.4 | 125.3 | 122.8 | 131.0 | 131.3 | 131.1 | 138.4 |
| Germany | 96.4 | 99.0 | 104.5 | 110.0 | 115.8 | 117.9 | 110.8 | 108.1 |
| Hong Kong, China | 88.0 | 84.4 | 91.7 | 97.9 | 64.9 | 79.5 | 85.2 | 91.8 |
| India | 96.5 | 99.7 | 100.2 | 105.2 | 106.6 | 111.8 | 110.5 | 115.3 |
| Indonesia | 89.0 | 94.0 | 99.6 | 100.5 | 96.6 | 98.1 | 90.6 | 94.5 |
| Italy | 117.8 | 116.8 | 116.1 | 126.4 | 130.2 | 131.7 | 141.7 | 137.9 |
| Japan | 72.0 | 79.2 | 98.3 | 112.6 | 120.4 | 122.0 | 136.5 | 138.2 |
| Mexico | 133.1 | 124.5 | 135.6 | 142.3 | 142.5 | 140.3 | 135.3 | 130.0 |
| Russia | 112.9 | 112.9 | 112.8 | 112.5 | 113.0 | 113.7 | 96.0 | 96.7 |
| Singapore | 108.2 | 108.1 | 103.2 | 100.6 | 112.1 | 119.2 | 114.7 | 108.6 |
| South Africa | 82.3 | 84.0 | 83.4 | 86.7 | 97.7 | 96.6 | 96.0 | 95.9 |
| Spain | 114.5 | 116.6 | 119.3 | 131.8 | 136.0 | 133.0 | 131.4 | 126.7 |
| Thailand | 93.4 | 94.8 | 102.3 | 102.2 | 123.3 | 136.8 | 128.1 | 126.2 |
| Turkey | 124.1 | 137.8 | 146.3 | 137.8 | 117.8 | 110.0 | 116.3 | 118.1 |
| U.S. | 112.7 | 112.3 | 110.3 | 120.3 | 129.9 | 128.5 | 125.6 | 126.8 |
| United Arab Emirates | 126.5 | 130.7 | 128.6 | 126.6 | 140.3 | 147.1 | 142.5 | 145.0 |
| United Kingdom | 132.3 | 129.3 | 125.0 | 126.7 | 134.8 | 129.5 | 131.5 | 128.5 |
Vacation Rentals contributes 10% to the total score. The scores in this table have been indexed to give a better insight into performance. 100 = pre-pandemic level. 2021 VR data for Argentina missing.
Car Rental Scores by Country
| Sep 2022 | Oct 2022 | Nov 2022 | Dec 2022 | Jan 2023 | Feb 2023 | Mar 2023 | Apr 2023 | |
|---|---|---|---|---|---|---|---|---|
| Argentina | 114.3 | 99.5 | 82.9 | 79.6 | 94.1 | 88.9 | 85.9 | 97.5 |
| Australia | 106.1 | 106.5 | 103.7 | 110.7 | 110.3 | 106.3 | 105.5 | 107.1 |
| Brazil | 96.4 | 93.4 | 89.6 | 91.9 | 98.8 | 98.8 | 94.3 | 98.7 |
| Canada | 117.6 | 122.7 | 122.0 | 117.5 | 129.1 | 126.2 | 119.4 | 118.3 |
| China | 56.7 | 85.4 | 82.5 | 66.2 | 63.4 | 101.4 | 124.0 | 135.0 |
| France | 104.0 | 103.3 | 102.6 | 101.0 | 133.6 | 129.9 | 115.5 | 121.4 |
| Germany | 85.7 | 84.5 | 84.1 | 95.6 | 85.6 | 84.7 | 85.7 | 85.0 |
| Hong Kong, China | 102.1 | 118.4 | 105.0 | 105.8 | 109.5 | 121.6 | 117.5 | 109.8 |
| India | 107.3 | 114.6 | 109.6 | 103.1 | 110.9 | 121.3 | 121.2 | 117.3 |
| Indonesia | 107.3 | 114.6 | 109.6 | 103.1 | 110.9 | 121.3 | 121.2 | 117.3 |
| Italy | 81.4 | 76.9 | 83.3 | 100.9 | 80.8 | 79.7 | 83.7 | 84.4 |
| Japan | 100.2 | 98.7 | 95.1 | 99.4 | 114.1 | 113.1 | 117.6 | 116.7 |
| Mexico | 116.3 | 112.9 | 109.2 | 112.7 | 129.8 | 124.0 | 120.5 | 113.4 |
| Russia | 74.6 | 74.6 | 74.6 | 74.6 | 74.6 | 74.6 | 74.6 | 74.6 |
| Singapore | 123.7 | 118.8 | 114.4 | 111.3 | 119.6 | 127.0 | 120.0 | 116.2 |
| South Africa | 102.1 | 103.8 | 103.0 | 100.8 | 107.6 | 107.9 | 105.5 | 103.0 |
| Spain | 88.2 | 88.3 | 94.0 | 106.9 | 89.3 | 87.6 | 87.9 | 88.1 |
| Thailand | 103.0 | 98.3 | 93.7 | 95.8 | 102.1 | 107.3 | 100.5 | 98.7 |
| Turkey | 88.8 | 102.4 | 99.9 | 99.3 | 109.9 | 95.3 | 104.3 | 109.2 |
| U.S. | 127.0 | 127.3 | 128.8 | 124.4 | 116.1 | 107.0 | 98.2 | 97.1 |
| United Arab Emirates | 117.9 | 114.9 | 113.1 | 110.4 | 115.9 | 121.2 | 114.4 | 121.5 |
| United Kingdom | 113.2 | 115.1 | 108.7 | 108.1 | 117.7 | 113.3 | 110.2 | 107.2 |
Car Rental contributes 15% to the total score. The scores in this table have been indexed to give a better insight into performance. 100 = pre-pandemic level.
Disclaimer: All rights reserved; content based on data provided by Amadeus, Aviasales, Beyond, CarTrawler, Cendyn, Collinson, Criteo, Duetto, ForwardKeys (Forward Data SL), Hotelbeds, Key Data Dashboard, Nium, OAG, Onyx CenterSource, OTA Insight, RateGain, Shiji Group, Skyscanner, Sojern, Transparent, TravelgateX, TrustYou. The content and the data provided in this document are for your information and internal use only. The content is provided “as is” without any warranty as to accuracy, completeness, satisfactory quality or fitness for any particular purpose. It is strictly forbidden to extract, reproduce, republish or publicly display any content included in this document without the prior written authorization of Skift Research. If you wish to use any of this content or similar data, please contact Skift Research for more information.