
Last update: January 2024
The Skift Travel Health Index
The Skift Travel Health Index is a real-time measure of the performance of the travel industry and its core sectors across 22 countries. This dynamic tool can help businesses with strategic planning and identify potential areas for growth analysis.
The Index was initially launched by Skift Research in May 2020 as the Skift Recovery Index to monitor the industry’s climb out of the depths of the pandemic. It underwent a rebrand at the beginning of 2022, becoming the “Skift Travel Health Index.”
This rebranding effort included adding more indicators and collaboration with more data partners, strengthening the tool, and going beyond analyzing recovery to gauging industry performance. This approach has continued, ensuring monthly comprehensive and in-depth analysis of the travel landscape.
The Skift Travel Health Index comprises several key components to assess the travel industry:
- Monthly global and country-specific travel indices.
- Monthly country-level indices focusing on travel verticals such as hotels, vacation rentals, aviation, and car rentals.
- Monthly performance of inbound, outbound, and domestic travel by country.
- A view of the customer journey, starting with website visits and searches on booking platforms, progressing to actual bookings and reservations, considering factors like airline seat capacity, cancellations, passenger volumes, load factors, and actual accommodation stays.
- A range of indicators that account for completed trips and future reservations currently in the booking pipeline.
Index Design
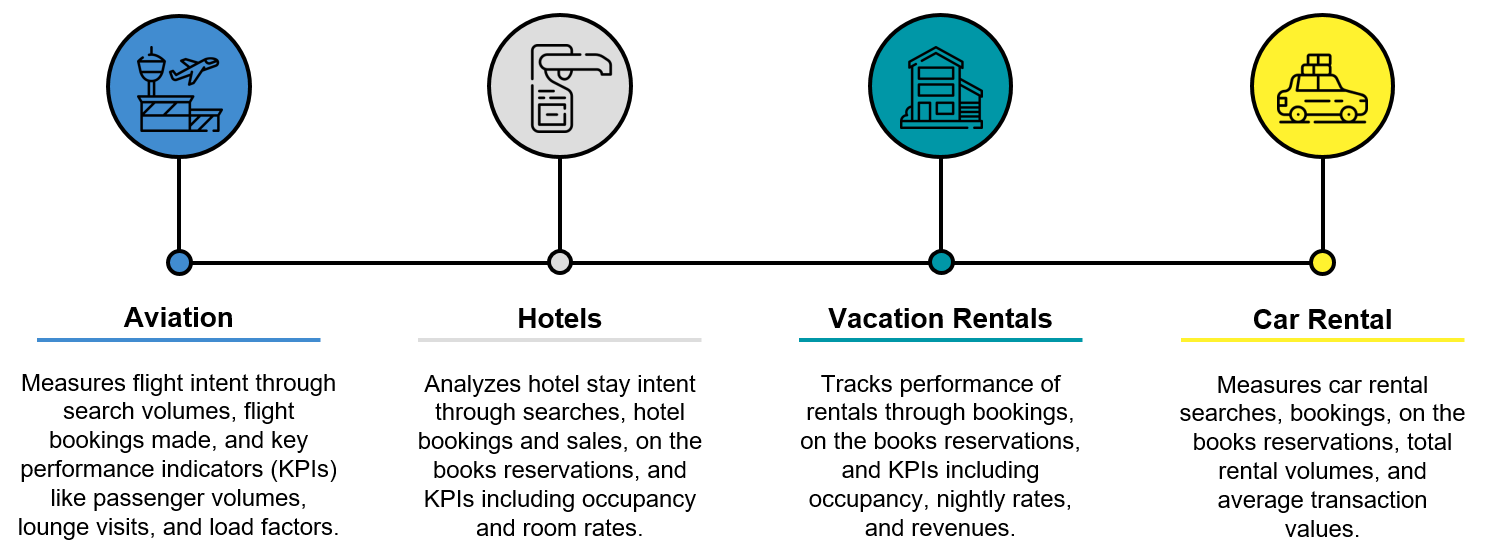
The Index monitors 80 indicators per country, providing an evaluation of the health of the travel industry in each country. The indicators are grouped and aggregated into performance categories and further into sub-categories. At the top level, the division is by travel vertical. Each vertical is further divided into intent indicators, booking indicators, and key performance indicators.
Vertical Coverage
The Index covers the following travel verticals:
Country Coverage
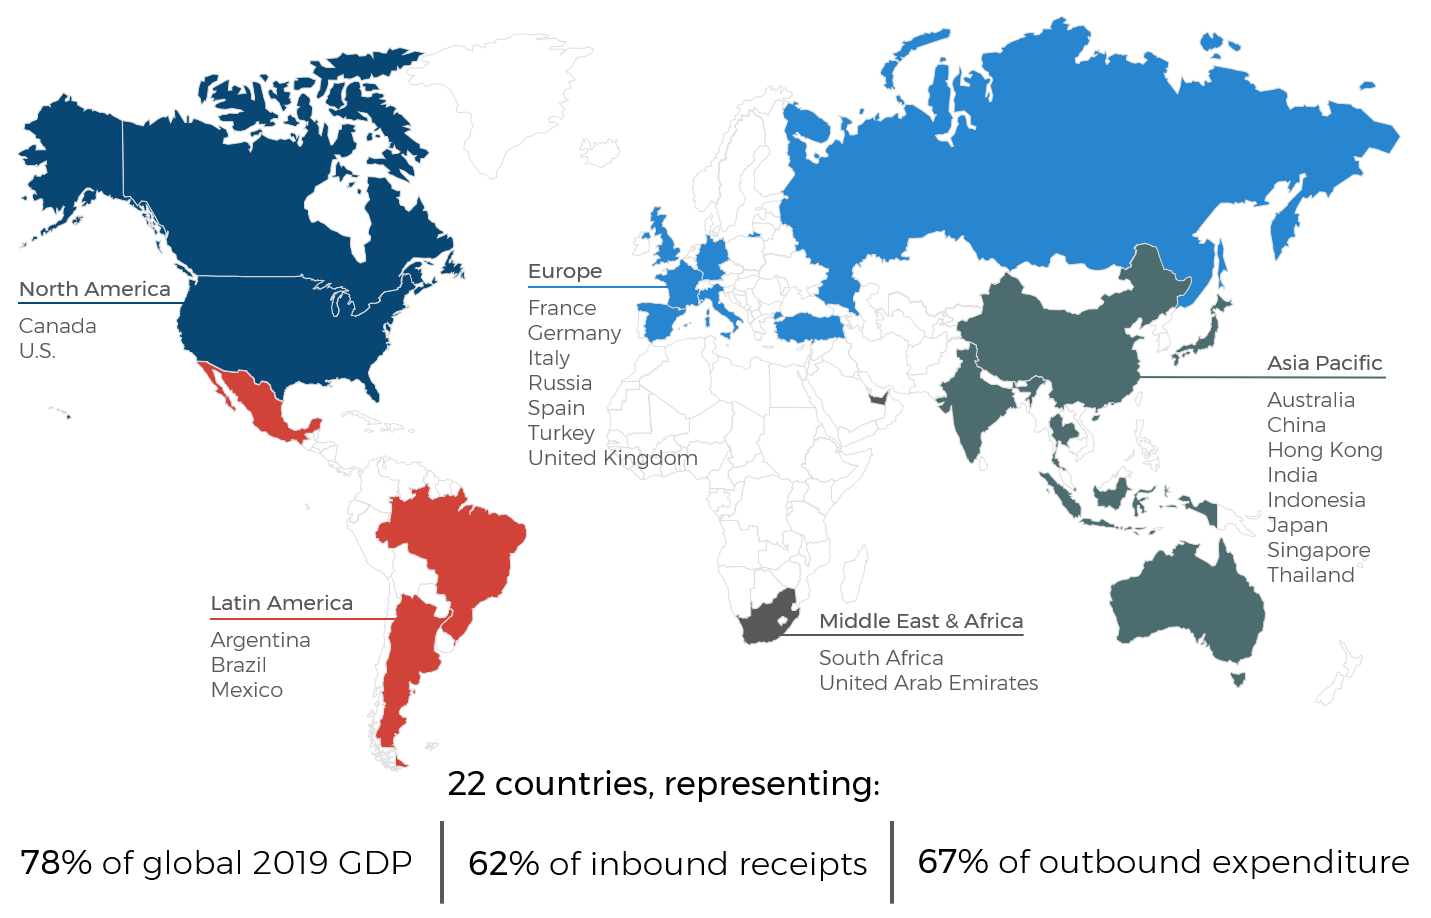
The Index focuses on the travel performance in 22 of the largest tourism economies. Together, the countries account for 62% of inbound tourism receipts, 67% of outbound tourism expenditure, and 78% of global 2019 GDP.
- Argentina
- Australia
- Brazil
- Canada
- China
- France
- Germany
- Hong Kong, China
- India
- Indonesia
- Italy
- Japan
- Mexico
- Russia
- Singapore
- South Africa
- Spain
- Thailand
- Turkey
- U.S.
- United Arab Emirates
- United Kingdom
The chosen countries represent a combination of the largest economies, top tourist destinations, and key origin markets. The selection intentionally includes net exporters of tourism (more inbound tourism than outbound tourism) and net importers of tourism to track how this impacts overall travel performance.
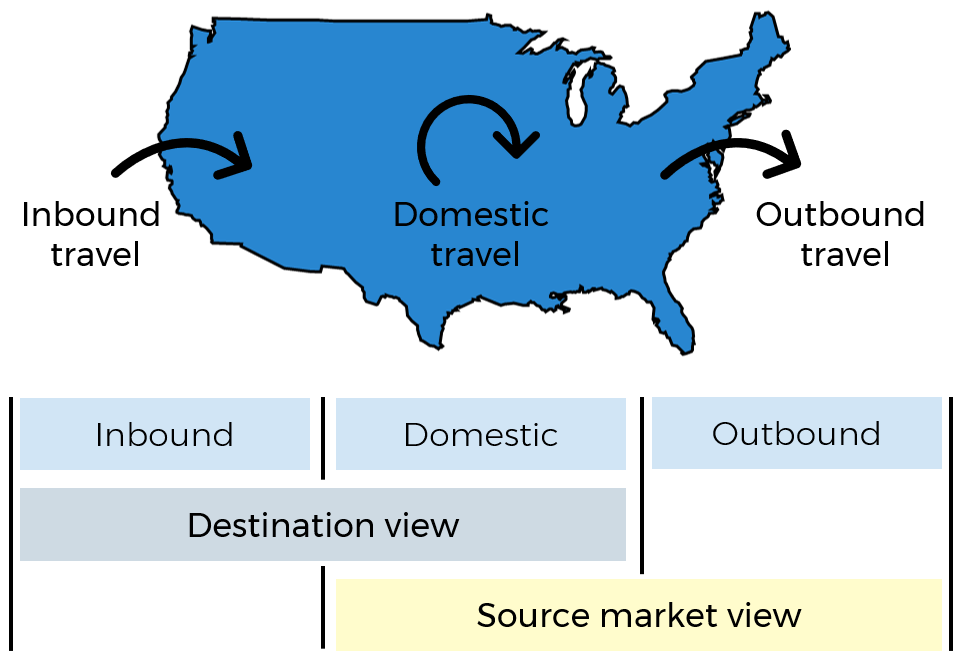
Source Market vs Destination
The Index design depends on the availability of data, which is driven by industry standards in each travel vertical. Therefore, the Index is designed to incorporate a mix of market focuses.
As available, the Index divides the data into three aspects: inbound, domestic, and outbound. Not all data sources, however, have this level of granularity available. Due to variations in data granularity across sources, the index introduces another divide, splitting demand into a destination view (combining inbound and domestic travel) and a source market view (combining domestic and outbound travel). This approach ensures transparency in understanding the specific focus of each indicator, facilitating precise analysis and reporting.
Reliance on Multiple Sources
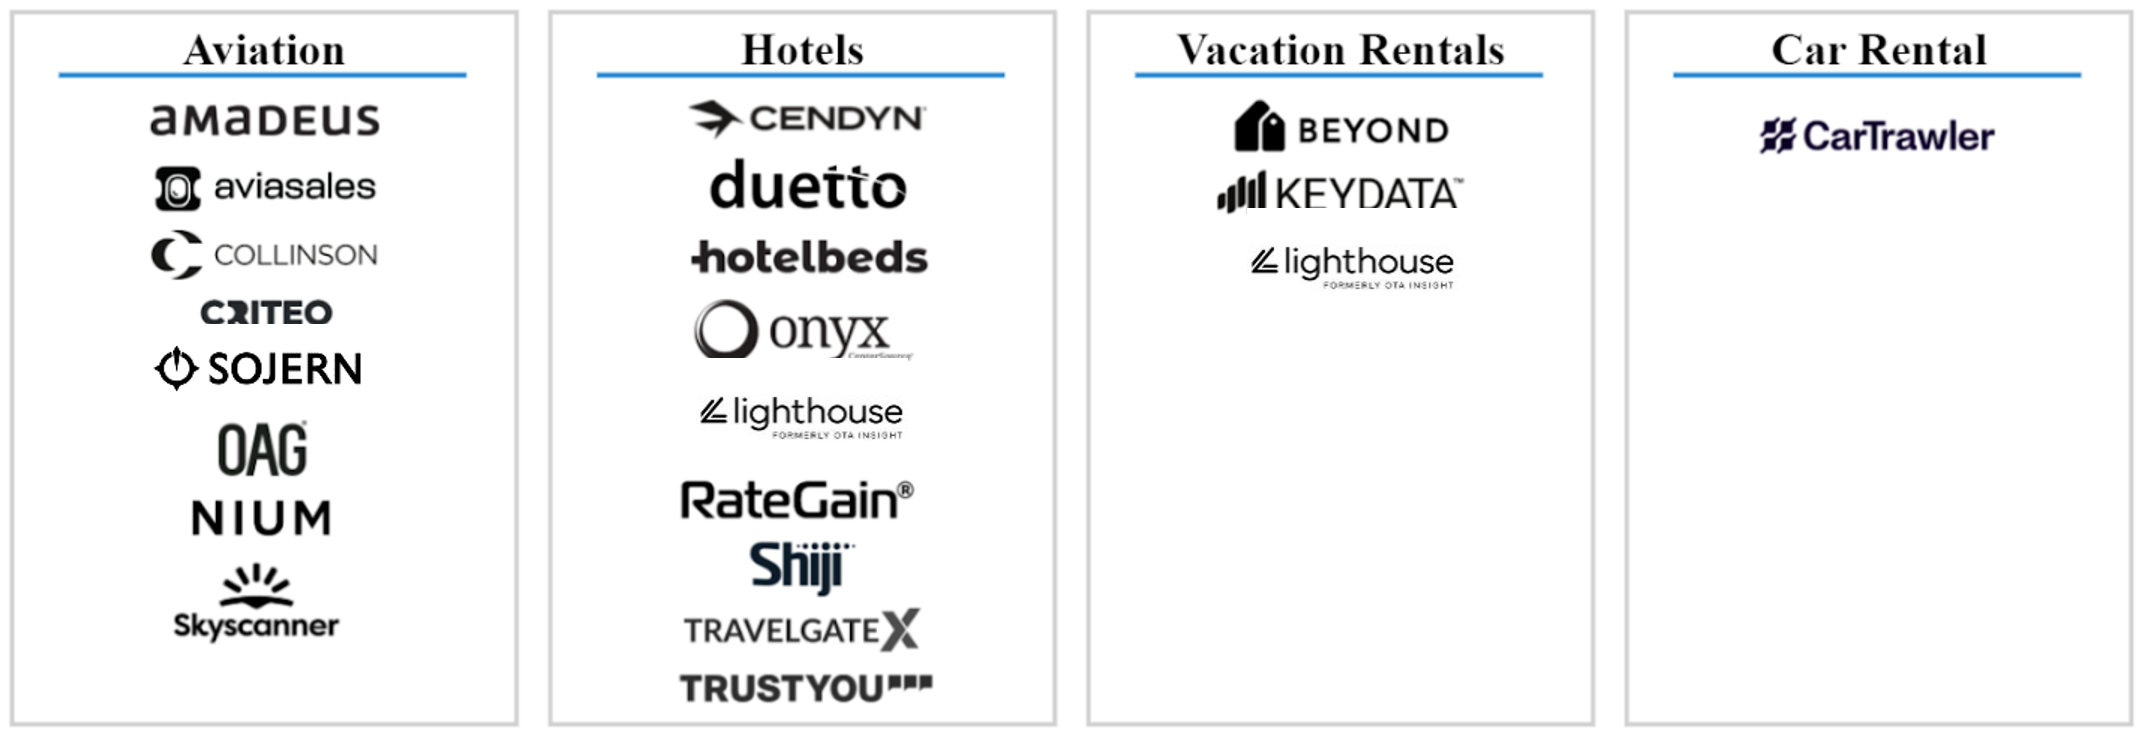
One of the critical strengths of the Index is its reliance on a wide range of sources for each category and subcategory. Collaborating with diverse industry-leading travel entities, we input proprietary data into the Index.
Further information about each data partner can be found at the end of this document.
Indicator Weighting
Originally named the Skift Recovery Index, the index measured travel performance monthly against 2019 levels, considered the last best-performing year for the travel industry. Despite the rebranding in 2022, 2019 remained the primary benchmark. Growth rates for each year (2019/20, 2019/21, 2019/22, and 2019/23) were indexed, with the 2019 volume or value set at 100. A score of 100 indicated that the performance was on par with 2019, with scores above 100 indicating growth and below 100 indicating contraction.
The global travel average has consistently surpassed 2019 levels since April 2023, establishing new benchmarks. Therefore, moving forward, while the methodology for the index will remain unchanged, the benchmark year will be shifted to the year right before the current year instead of 2019. For instance, growth rates for 2024 will be indexed to the 2023 value set at 100. A score of 100 will signify that the performance in 2024 is equivalent to that in 2023. Scores above 100 indicate growth, and scores below 100 signify contraction.
Each indicator is weighted to provide a final index score, and the weighting is determined by Skift Research estimates of the relative importance of different travel verticals. Additionally, the strength and reliability of indicators play a crucial role in offering conclusive insight into the industry’s performance. For instance, while search data provides an indication of travel intent, actual transactional data, such as hotel occupancy, is considered more critical as an indicator of recovery on the ground. Therefore, hotel occupancy carries a higher weight than hotel searches in the overall calculation.
Any given category or subcategory “buckets” has several different indicators. For example, airline passenger volume data, load factors, and revenue per kilometer flown are all indicators, but they roll into the same ‘Aviation KPIs’ sub-category. Typically, all indicators within a given metric are equally weighted.
Each category and subcategory combines data from different data partners to strengthen the data, with the only exception being the car rental category, which is provided by a single data provider.
As not all indicators are available for each country, weightings differ slightly per country, but below is a table with ideal weightings by category and metrics when all indicators are available.
| Category | Subcategory |
|---|---|
| Aviation – 40% | Flight Intent – 20% |
| Flight Bookings – 35% | |
| Flight Key Performance Indicators – 45% | |
| Hotels – 35% | Hotel Stay Intent – 10% |
| Hotel Bookings – 60% | |
| Hotel Key Performance Indicators – 30% | |
| Vacation Rentals – 10% | Vacation Rental Bookings – 20% |
| Vacation Rental Key Performance Indicators – 80% | |
| Car Rental – 15% | Car Rental Intent – 20% |
| Car Rental Bookings – 40% | |
| Car Rental Key Performance Indicators – 40% |
Index Score Calculation
The Index is designed to provide an easy overview of the health of the travel industry.
We have tracked the industry since the beginning of 2020. From 2020 to 2023, each indicator’s performance was compared to the same time in 2019. This means that calculations look as follows:
- Performance in January 2020 (Jan 1 – 31 2020) compared to January 2019 (Jan 1 – 31 2019)
- Performance in January 2021 (Jan 1 – 31 2021) compared to January 2019 (Jan 1 – 31 2019)
- Performance in January 2022 (Jan 1 – 31 2022) compared to January 2019 (Jan 1 – 31 2019)
- Performance in January 2023 (Jan 1 – 31 2023) compared to January 2019 (Jan 1 – 31 2019)
The Index provided a score relative to a baseline reading of 100 for the same month in 2019.
In 2024 and beyond, each indicator’s performance will be compared to the same time in the previous year. This means that calculations will look as follows:
Performance in January 2024 (Jan 1 – 31 2024) compared to January 2023 (Jan 1 – 31 2023)
The Index considers seasonality, acknowledging the fluctuations in the travel industry that affect countries and sectors differently. By comparing the current month with the same month in the previous year, the Index compensates for any seasonal variations.
Changes to the Index at the beginning of 2021, 2022, and 2023 aimed to enhance data quality by including additional data partners and indicators. These modifications resulted in time series breaks, potentially impacting growth rate comparisons between December and January 2020/21, 2021/22, and 2022/23.
Retrospective Data Changes
The Index is designed to be near real-time, with monthly updates reflecting the most recent data. Data partners typically provide information within one week after the end of each month, ensuring timely updates to the Index scores.
A few indicators have a longer lag time, including hotel occupancy from STR and flight load factors from IATA.
In these instances, we use the most recent month’s data to make an estimate for the current month. We update this retrospectively when data becomes available, which might result in historical revisions to the Index scores.
Indicators by Vertical
Hotels Indicators
| Subcategory | Indicator | Source |
|---|---|---|
| Hotel Stay Intent | Hotel search – dom | Sojern |
| Hotel search – inb | Sojern | |
| Hotel search – outb | Sojern | |
| Hotel Bookings | Hotel bookings – dom + inb | Shiji |
| Hotel bookings – dom + inb | Duetto | |
| Hotel bookings – dom + inb | Onyx CenterSource | |
| Hotel bookings – dom + inb | RateGain | |
| Hotel bookings – dom + inb | Criteo | |
| Hotel room nights – dom | Hotelbeds | |
| Hotel room nights – outb | Hotelbeds | |
| Hotel room nights – inb | Hotelbeds | |
| Hotel room nights – dom + inb | Shiji | |
| Hotel sales – dom + inb | Onyx CenterSource | |
| Hotel sales – dom + inb | Cendyn | |
| Hotel sales – dom + inb | TravelgateX | |
| Hotel sales – dom + outb | TravelgateX | |
| Hotel sales – dom | Hotelbeds | |
| Hotel sales – outb | Hotelbeds | |
| Hotel sales – inb | Hotelbeds | |
| On the books reservations (+90 days) – dom + inb | Duetto | |
| Hotel KPIs | Hotel published rates | Lighthouse (Formerly OTA Insight) |
| Hotel email campaigns | Cendyn | |
| Hotel reviews | TrustYou | |
| Hotel occupancy | STR (public data) |
dom = domestic travel; inb = inbound travel; outb = outbound travel
Aviation Indicators
| Subcategory | Indicator | Source |
|---|---|---|
| Flight Intent | Flight search – dom | Amadeus |
| Flight search – dom | Aviasales | |
| Flight search – dom | Skyscanner | |
| Flight search – dom | Sojern | |
| Flight search – inb | Amadeus | |
| Flight search – inb | Skyscanner | |
| Flight search – inb | Sojern | |
| Flight search – outb | Amadeus | |
| Flight search – outb | Aviasales | |
| Flight search – outb | Skyscanner | |
| Flight search – outb | Sojern | |
| Flight bookings – dom + outb | Criteo | |
| Flight bookings – dom | Aviasales | |
| Flight bookings – outb | Aviasales | |
| Average transaction value – dom + outb | Nium | |
| Flight KPIs | Flight seat capacity – dom | OAG |
| Flight seat capacity – int | OAG | |
| Airport lounge visits – resident | Collinson | |
| Airport lounge visits – international visitors | Collinson | |
| Flight load factor – dom | IATA (public data) | |
| Flight load factor – int | IATA (public data) | |
| Flight passenger volume – dom + inb | TSA (public data) | |
| Future flight seat capacity (+90 days) – dom | OAG | |
| Future flight seat capacity (+90 days) – int | OAG |
dom = domestic travel; inb = inbound travel; int = international; outb = outbound travel
Vacation Rentals Indicators
| Subcategory | Indicator | Source |
|---|---|---|
| Vacation Rental Bookings | Vacation rental bookings – dom + inb | Transparent |
| On the books vacation rental occupancy (+90 days) – dom + inb | Transparent | |
| On the books vacation rental occupancy (+90 days) – dom + inb | Key Data Dashboard | |
| Vacation Rental KPIs | Vacation rental realized occupancy | Transparent |
| Vacation rental realized occupancy | Key Data Dashboard | |
| Vacation rental ADR | Key Data Dashboard | |
| Vacation rental RevPAN | Beyond | |
| Forward-looking ADR (+90 days) | Key Data Dashboard | |
| Forward-looking ADR (+90 days) | Lighthouse (Formerly Transparent) | |
| Forward-looking RevPAN (+90 days) | Beyond |
dom = domestic travel; inb = inbound travel; outb = outbound travel
Rental Car Indicators
| Subcategory | Indicator | Source |
|---|---|---|
| Car Rental Intent | Car rental search – dom | CarTrawler |
| Car rental search – inb | CarTrawler | |
| Car rental search – outb | CarTrawler | |
| Car Rental Bookings | Car rental bookings – dom | CarTrawler |
| Car rental bookings – inb | CarTrawler | |
| Car rental bookings – outb | CarTrawler | |
| On the books car reservations (+90 days) – dom | CarTrawler | |
| On the books car reservations (+90 days) – inb | CarTrawler | |
| On the books car reservations (+90 days) – outb | CarTrawler | |
| Car Rental KPIs | Total rental volume (days) – dom | CarTrawler |
| Total rental volume (days) – inb | CarTrawler | |
| Total rental volume (days) – outb | CarTrawler | |
| Total Transaction Value per day – dom | CarTrawler | |
| Total Transaction Value per day – inb | CarTrawler | |
| Total Transaction Value per day – outb | CarTrawler |
dom = domestic travel; inb = inbound travel; outb = outbound travel
Inverted Indicators
Cancellations data is included in the Index to enhance accuracy, serving as a negative indicator that is factored in addition to the overall Index score. If cancellations exceed the levels observed in the same month in the previous year, this results in a negative score, which is then subtracted from the total Index score. This addition provides a more comprehensive assessment of the travel industry’s performance.
The maximum cancellation score is set at 0 (lower cancellations mean no subtraction), and the minimum score is capped at half of the total booking indicators’ weight. For example, there are 15 indicators tracking hotel booking data, with an aggregate weight of 19.5%. The cancellation data score can be a maximum of 0 and a minimum of -9.75 (half of 19.5%).
| Category | Indicator | Source |
|---|---|---|
| Cancellations | Hotel cancellations – dom + inb | RateGain |
| Hotel cancellations – dom + inb | Duetto | |
| Hotel cancellations – dom + inb | Onyx CenterSource | |
| Vacation rental cancellations – dom + inb | Key Data Dashboard | |
| Car rental cancellations – dom | CarTrawler | |
| Car rental cancellations – inb | CarTrawler | |
| Car rental cancellations – outb | CarTrawler |
Additional Data Insights
To further benefit our analysis of the travel industry, select data partners provide additional data which is not included in the Index, but is used in our analysis and reporting. This data can also be found on the dashboard on the Skift Research website.
| Indicator | Source |
|---|---|
| Vacation rental occupancy and ADR, split by professional property managers vs individual hosts | Beyond |
| Vacation rental average length of stay, split by professional property managers vs individual hosts | Beyond |
| Vacation rental booking windows, split by professional property managers vs individual hosts | Beyond |
| Hotel average length of stay | Hotelbeds |
| Hotel booking windows | Hotelbeds |
| Flight seat capacity, split by low cost carrier vs legacy airline | OAG |
| Hotel reviews by traveler type | TrustYou |
| Length of stay by source and destination | TravelgateX |
| Booking window by source and destination | TravelgateX |
Data Partners
Skift Research collaborates with 21 data partners to provide monthly updated data, without which the Index would not be able to exist.
Below is a brief explanation of the partners we work with, the data they share, and their methodology.
Amadeus
Amadeus is a global travel technology leader that delivers the most trusted, critical systems across the travel industry to airlines, airports, hotels, travel agents, and car rental and railway providers.
Amadeus is providing insight on travel search trends and behavior for the Index. The search data is derived from Amadeus Agency Insights, the company’s business intelligence suite of solutions and services designed for travel agencies. Built using data from over 200 million weekly online searches stored in Amadeus Master Pricer, this search data is the most comprehensive dataset available that represents the global travel agency community.
Aviasales
Aviasales was launched as a blog on bargain air tickets in 2007 and grew to become the world’s biggest independent travel search. Similarweb ranks Aviasales among the top 15 most popular air travel websites, and Skift listed the services as a startup to watch in 2019.
Today Aviasales serves 20 million monthly active users from Eastern Europe & Central Asia. Aviasales provides flight searches and booking data from the Russian market for the Index.
Beyond
Beyond is a leading revenue management platform for short-term rental owners and managers to get, grow, and keep revenue. The easy-to-use platform includes a dynamic, demand-driven pricing tool with extensive market data that pairs with OTA distribution and a best-in-class booking engine.
Founded in 2013, Beyond has supported over 340,000 properties in more than 7,500 cities worldwide and has enabled billions of dollars in booking revenue. The company provides Revenue per Available Night (RevPAN) data for the Index. Beyond also provides data on the average length of stay, booking windows, and average daily rates, all split between individual hosts and professional property managers, for the dashboard on the Skift Research website.
CarTrawler
CarTrawler is a leading b2b technology provider of car rental and mobility solutions to the global travel industry. CarTrawler’s purpose is to drive successful partnerships, with the company’s end-to-end technology platform expanding airline and travel partners’ offerings to their customers and creating substantial ancillary revenue opportunities. The company provides unrivaled breadth and depth of content worldwide, including car rental, private airport transfers, and ride-hailing services. CarTrawler works with leading brands, including United Airlines, American Express, Hopper, EasyJetet, Alaska Airlines, SWISS, Hotels.com, and Emirates.
CarTrawler is the exclusive provider of car rental data for the Index, providing extensive data, including searches, bookings, transaction values, total rental days, and cancellations.
Cendyn
Cendyn is an innovative cloud software and service provider for the hospitality industry. Their software solutions drive sales, marketing, and revenue performance for tens of thousands of hotels across the globe, with a focus on integrated hotel CRM, hotel sales, and revenue strategy technology platforms.
The company provides different data points around hotel marketing campaigns for the Index, providing an innovative alternative set of metrics to measure the health of the hotel sector.
Collinson
Collinson is a global travel services business creating traveler experiences, loyalty strategies and programs, travel insurance, and travel and medical assistance. Collinson operates Priority Pass and provides frequent travelers access to over 1,300 lounges and airport experiences in over 650 airports across 148 countries.
Collinson is providing aggregated customer lounge visit data from 302 lounges across 15 countries for the Index.
Criteo
Criteo is a global technology company powering the world’s marketers with trusted and impactful advertising. Criteo supports suppliers, online travel agencies, and meta sites with over 600 travel accounts globally. The foundation of Criteo’s travel offering lies in its ability to understand a user’s path-to-booking journey, tying awareness and intent-driven marketing to performance-driven strategies built to drive leads and bookings further down the funnel.
Criteo provides hotel and airline booking data for the Index.
Duetto
Duetto delivers a suite of cloud applications to simplify hospitality revenue decisions and allow hoteliers to work smarter, increasing organizational efficiency, revenue, and profitability. Its software as a service platform allows hotels and casino resorts to leverage real-time dynamic data sources and actionable insights into pricing and demand across the enterprise. More than 4,000 hotel and casino resort properties in more than 60 countries have partnered to use Duetto’s applications
Duetto is providing hotel performance data for the Index, including new bookings, on-the-books reservations, and cancellations.
Hotelbeds
Hotelbeds provides over 180,000 hotels across the globe with access to high-value, complementary distribution channels that do not compete with the hotelier’s direct distribution strategy. It offers a network of over 60,000 hard-to-access b2b travel buyers, such as tour operators, retail travel agents, airline websites, and loyalty partners. The company is predominantly focused on the leisure travel market.
Hotelbeds provides data on hotel room nights and hotel room sales for the Index. Furthermore, Hotelbeds provides data on the length of stay and booking windows for the dashboard on the Skift Research website.
Key Data Dashboard
Key Data is a provider of real-time, direct-source vacation rental data for the short-term rental sector. Through direct-source integrations with reservation systems for vacation rental professionals and resorts around the world, Key Data aggregates historical and forward-looking data in near real-time.
Key Data aggregates short-term rental data sourced directly from more than 30+ reservation systems of 700+ professional property managers around the world, providing occupancy and ADR data for the Index.
Lighthouse (Formerly OTA Insight and Transparent)
Lighthouse (formerly OTA Insight) empowers hoteliers to deliver smarter revenue, distribution, and marketing outcomes through its market-leading commercial platform. With live updates, 24/7 support, and highly intuitive and customizable dashboards, OTA Insight integrates with industry tools, including hotel property management systems, leading RMS solutions, and data benchmarking providers.
Lighthouse (formerly OTA Insight) provides hotel average published rates data for the Index. This data is sourced from the company’s Rate Insight product, which provides real-time rate data per destination from thousands of hotels all around the world.
Lighthouse (formerly Transparent) provides business intelligence serving the vacation rental industry. Through a combination of proprietary and public data aggregation and data science, Transparent develops insights into market conditions such as supply growth, demand patterns, rate changes, and property manager activities.
Lighthouse (formerly Transparent) contributes occupancy, bookings, and pacing data for the Index. The company draws on data from the 34 million vacation rental listings it tracks worldwide in every geography.
Nium
Nium is a platform for global business payments. The company provides banks, payment providers, and businesses access to global payment solutions in more than 100 currencies in over 190 countries. Nium holds regulatory licenses and authorizations in over 40 countries, enabling seamless global payments and rapid integration, regardless of geography.
Nium contributes to the index by providing data on the average transaction value of flights.
OAG
OAG is a leading global travel data provider that has been powering the growth and innovation of the air travel ecosystem since 1929. The company collects data about every journey, every booking, every take-off and landing, departure and delay, totaling over 110,000 flights, 100,000 schedule changes daily, and over 4 million flight status updates. OAG provides further information and webinars about the impact of COVID-19 on the airline industry here.
OAG provides seat capacity data for the Index. Flight capacity data is the number of scheduled seats as supplied by the world’s global airlines and distributed by OAG on their behalf to all the major distribution channels and analytics sources on both a daily and weekly basis. The data is also used in the dashboard that can be found on the Skift Research website.
Onyx CenterSource
Onyx CenterSource is a leading global provider of business-to-business payments and business intelligence solutions to the hospitality industry. With a legacy dating to 1992, the company facilitates in excess of $2.1 billion in payments annually, partnering with more than 150,000 hotel properties and 200,000 travel booking providers in 160 countries. Onyx is headquartered in Dallas and has regional hubs in Seville, Spain, and Tønsberg, Norway.
Onyx provides data on the number of hotel stays, cancellations, and commissions registered in hotels that use their systems.
RateGain
RateGain is a leading provider of SaaS products that help travel and hospitality companies with cognitive revenue management, smart e-distribution, and brand engagement. RateGain supports over 250,000 hotel properties globally by providing 240 billion rate and availability updates and powering over 30 million bookings. RateGain’s clients include the largest OTAs, airlines, hotel chains, tour operators, wholesalers, car rental companies, cruise lines, and travel management companies.
RateGain provides hotel bookings and cancellation data for the Index.
Shiji Group
Shiji Group provides software solutions and services for the hospitality, food service, retail, and entertainment industries, ranging from hotel management solutions to food and beverage and retail systems, payment gateways, data management, online distribution, and more. Founded in 1998 as a network solutions provider for hotels, Shiji Group today serves over 74,000 hotels, 200,000 restaurants, and 600,000 retail outlets across the world.
Shiji Group provides China hotel bookings and room night data for the Index.
Skyscanner
Skyscanner began in 2003 as a simple flight search engine. Still, today, it is a leader in travel with 100 million peak monthly active users, over 100 million app downloads, and more than 1,200 partners across flights, hotels, car rental, and more. Skyscanner’s Travel Insight product enables businesses to analyze search and booking trends to help them make smarter, faster decisions and guide their COVID-19 recovery plans.
Travel Insight captures 295 data points during every search and redirects them, revealing powerful insights into where people are going now and where they want to travel in the next 12 months. Skyscanner provides flight search data for the Index.
Sojern
Sojern provides digital marketing solutions for the travel industry. Powered by artificial intelligence and built on more than a decade spent analyzing traveler intent data, Sojern activates multi-channel branding and performance marketing solutions to drive direct demand for more than 10,000 hotels, attractions, tourism boards, and travel marketers.
Sojern contributes flight and hotel search data for the Index. The company collects and analyzes travel data from thousands of partners around the world. This gives Sojern an unprecedented view of travel demand and is the basis of the Sojern insights presented in the Index.
TravelgateX
TravelgateX is an online B2B marketplace that provides seamless connectivity to travel companies across the world. With over 1000 partners, the company provides easy-to-integrate APIs that simplify searching, comparing, and booking travel products.
TravelgateX analyzes data gathered from multiple travel partners and contributes hotel sales data by source country and destination for the Index. The company also provides data on length of stay and hotel booking window.
TrustYou
TrustYou provides a guest feedback platform that makes listening to customers easy, powerful, and actionable. The platform unlocks the potential of guest feedback and helps hoteliers make better business decisions and publish reviews on the hotel website and on Google, all to allow positive feedback to influence bookings.
In response to the current crisis, TrustYou put together a Travel Health Index, using hotel reviews managed through its platform as a proxy for hotel occupancy. TrustYou provides this review volume data for the Index and further details on traveler segments for the dashboard that can be found on the Skift Research website.
Definitions
The following is a list of all indicators and their definitions.
Hotels
Hotel searches: Volume of hotel searches in month n, compared to the same month in the previous year, by residents from the country (domestic, outbound) or travelers to the country (inbound).
Hotel bookings: Volume of bookings/reservations made in month n, compared to the same month in the previous year, for hotels in the country. The data is not corrected for cancellations or no-shows.
Hotel room nights: Volume of total number of room nights sold in month n, compared to the same month in the previous year, for hotels in the country, or hotel room nights booked by residents of the country. The data is not corrected for cancellations or no-shows.
Hotel sales: Value of the total number of rooms or room nights sold in month n, compared to the same month in the previous year, for hotels in the country, or the value of hotel rooms or room nights booked by residents of the country. The data is not corrected for cancellations or no-shows.
On-the-books hotel reservations (+90 days): Volume of hotel reservations for three months or 90 days into the future that are ‘on the books’ as of the month’s end, compared to the same timeframe in the previous year. E.g. the volume of hotel reservations that are on the books for April 2024, as of the end of January 2024, compared to the volume of hotel reservations in April 2023, as of the end of January 2023.
Hotel occupancy: Realized occupancy for open hotels in each country, compared to the same month in the previous year. This is based on publicly available STR data.
Hotel published rates: Rates published on different online channels for open hotels in each country compared to the same month in the previous year.
Hotel reviews: An index put together by TrustYou, where hotel reviews managed through its platform are used as a proxy for hotel occupancy. The current month’s hotel review volumes are compared to the same month in the previous year and adjusted for currently closed hotels.
Aviation
Flight searches: Volume of flight searches in month n, compared to the same month in the previous year, with the country as the place of departure (outbound), arrival (inbound), or both departure and arrival (domestic).
Flight bookings: Volume of flight bookings in month n, compared to the same month in the previous year, with the country as the place of departure (outbound), arrival (inbound), or both departure and arrival (domestic).
On the books flight reservations (+90 days): Volume of flight reservations for three months or 90 days into the future that are ‘on the books’ as of the end of the month, as compared to the same timeframe in the previous year. E.g., the volume of flight bookings that are on the books for April 2024, as of the end of January 2024, compared to the volume of flight bookings in April 2023, as of the end of January 2023.
Flight seat capacity: Number of scheduled seats for routes to and from the country in month n, compared to the same month in the previous year.
Flight load factor: Measures the percentage of available seating capacity that is filled with passengers in month n, compared to the same month in the previous year. Publicly available data from IATA.
Airport lounge visits: Monthly aggregate lounge visits in month n, compared to the same month in the previous year, at airports in the country, split by residents and international travelers as per their residency.
Future flight seat capacity (+90 days): Number of scheduled seats for routes to and from the country three months into the future, compared to the same month in the previous year. E.g., the number of scheduled seats that are on the books for April 2024, as of the end of January 2024, compared to the number of scheduled seats in April 2023, as of the end of January 2023.
Average transaction value: Average amount paid for a single airline booking transaction made during month n, compared to the same month in the previous year.
Vacation Rentals
Vacation rental bookings: Volume of bookings made in month n, compared to the same month in the previous year, for vacation rentals/short-term rentals in the country.
On the books vacation rental reservations (+90 days): Volume of rental reservations for three months or 90 days into the future that are ‘on the books’ as of the end of the month, as compared to the same timeframe in the previous year. E.g. the volume of rental reservations that are on the books for April 2024, as of the end of January 2024, compared to the volume of rental reservations in April 2023, as of the end of January 2023.
Vacation rental occupancy: Realized occupancy for open short-term/vacation rentals in the country during month n, compared to the same month in the previous year.
Vacation rental ADR: Realized average daily rates for open short-term/vacation rentals in the country during month n, compared to the same month in the previous year.
Vacation rental RevPAN: Realized Revenue per Available Night for active rentals in the country, compared to the same month in the previous year.
On the books vacation rental occupancy (+90 days): On the books occupancy rate for three months or 90 days into the future, as of the end of the month, as compared to the same timeframe in the previous year. E.g. the occupancy rate that is on the books for April 2024, as of the end of January 2024, compared to the occupancy rate for April 2023, as of the end of January 2023.
Forward-looking ADR (+90 days): Publicized average daily rates for open short-term/vacation rentals for three months or 90 days into the future, as of the end of the month, as compared to the same timeframe in the previous year. E.g., the average daily rates for April 2024, as of the end of January 2024, compared to the average daily rates during April 2023, as of the end of January 2023.
Forward-looking RevPAN (+90 days): Realized Revenue per Available Night for three months or 90 days into the future, as of the end of the month, as compared to the same timeframe in the previous year. E.g., the realized RevPAN for April 2024, as of the end of January 2024, compared to the RevPAN during April 2023, as of the end of January 2023.
Car Rental
Car rental search: Volume of car rental searches in month n, compared to the same month in the previous year, with the country as the pickup location for domestic or international travelers (inbound) or the country as the source market for international travelers (outbound).
Car rental bookings: Volume of bookings made in month n, compared to the same month in the previous year, with the country as the pickup location for domestic or international travelers (inbound) or the country as the source market of international travelers (outbound).
On the books car reservations (+90 days): Volume of car rental reservations for three months or 90 days into the future that is ‘on the books’ as of the end of the month, as compared to the same timeframe in the previous year, with the country as a pickup location for domestic or international travelers (inbound) or the country as the source market for international travelers (outbound). E.g., the volume of car rental reservations that are on the books for April 2024, as of the end of January 2024, compared to the volume of car rental reservations in April 2023, as of the end of January 2023.
Total rental volume (days): Aggregate of all cars rented during month n, compared to the same month in the previous year, expressed as the total number of days, with the country as pickup location for domestic or international travelers (inbound), or the country as the source market of international travelers (outbound).
Total Transaction Value per day: Average daily price paid for a car rental booking made during month n, compared to the same month in the previous year, with the country as the pickup location for domestic or international travelers (inbound), or the country as the source market of international travelers (outbound).
Inverted indicators
Hotel/vacation rental/car rental cancellations: Volume of cancellations in month n, compared to the same month in the previous year, for hotels/vacation rentals/car rentals in the country. This is an inverse indicator, with higher cancellations providing a higher negative Index score.